NEO, EOS, LTC, Monero, Lumens: Technical Analysis March 17, 2018
Be it a brief altcoins recovery or not, this is exactly what the cryptocurrency market needs. From Lumens, NEO, LTC, Monero and even EOS, there is reliever and a pause of this relentless bear pressure.
Our focus today goes to Lumens and while it is generally bearish, the response at $0.20 or the 78.6% Fibonacci retracement level has been awesome.
Let’s have a look at these charts:
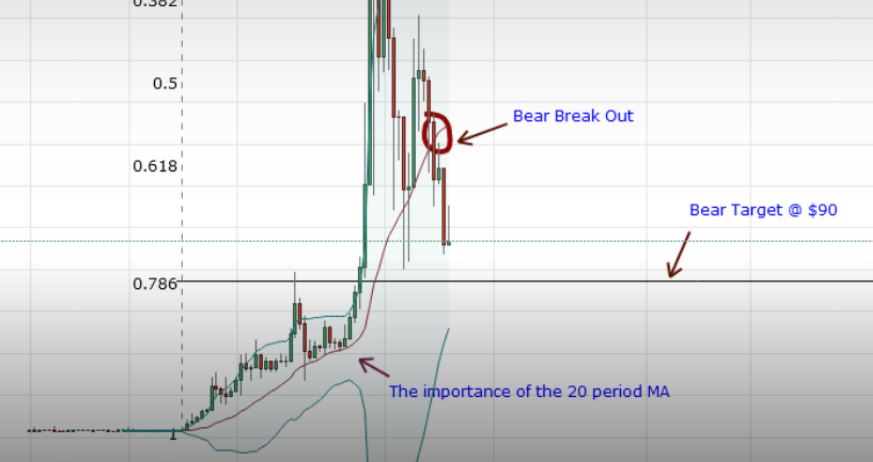
XLM/USD (Lumens)

While there is obvious reaction at around $0.20, Lumens swing sellers can literally pull off their short plug and what for a rebound of prices. Referring to yesterday’s forecast, our sell zone is set at or around recent highs of $0.30.
If prices do react and strong bear candlestick prints in the direction of the bearish break out pattern clear in the weekly chart then we can proceed with our previous projection and load shorts.
Otherwise, as we can see, $0.20 is important and being the 78.6% Fibonacci retracement level anchoring on this digital asset’s high low. I mean, with the accumulation and higher highs relative to the lower BB as visible in the 4HR chart, this level can as well be a perfect bull spring board.
However, before we draw conclusions, let’s wait and see what price action has.
XMR/USD (Monero)

According to our forecast, Monero is in a bear trend but with recent bullish development in lower time frames, sellers can as well stop shorting at-least for a couple of days.
In the 4HR chart, we can see some nice recovery in prices and with that stochastic buy signal and higher highs testing the middle BB and aiming towards $230, buyers might be angling to reverse recent losses.
But, here’s the thing. The rapid bear surge in the weekly chart means sellers will find favorable opportunities to short with every stochastics sell signal in the 4HR chart.
Those sell zones can be anywhere around $260-our immediate resistance level and the middle BB in the weekly chart according to our recent trade plan.
At the moment though, swing buyers can buy at $220 with safe stops at $200 and aim for $260.
EOS/USD (EOS)

While EOS prices are on a short term uptrend, let’s not forget that the general trend in higher time frame is mainly bearish. But nothing’s fixed. Price action changes all the time.
As such, over the short term, EOS bulls can begin looking for long openings in lower time frames and it would be preferable to go long whenever a stochastic buy signal prints.
At the moment, bulls are testing the middle BB. If they break and close above it now that a strong bullish candlestick is clear, we can trade a minor bull break out with targets at $5.8 and $6.2 respectively.
Further appreciation above $6.2 cancels this projection as it means presence of a stochastic buy signal in the daily chart. Tangentially, that could possibly signal shift of momentum despite surging bears.
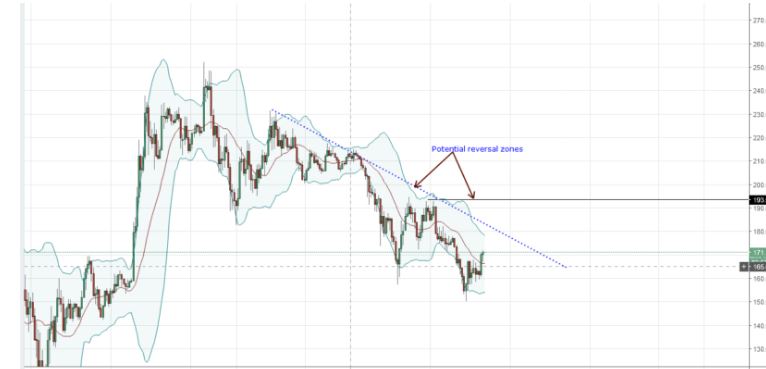
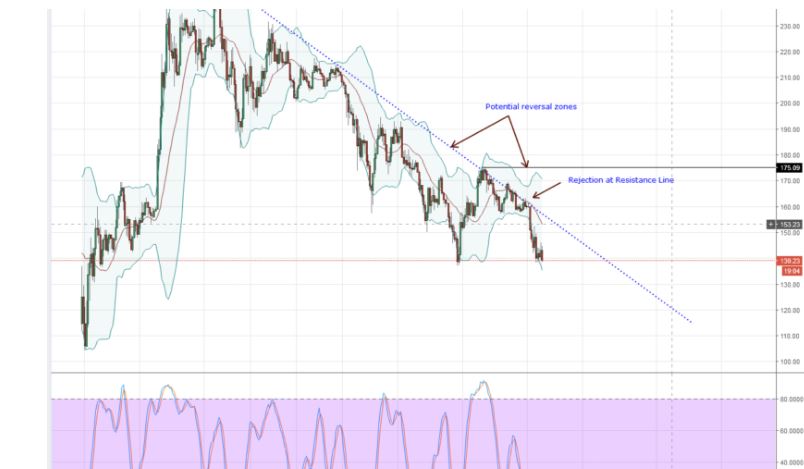
LTC/USD (LTC)

It is likely that LTC prices are turning the corner and even though we are naturally pessimistic about this recovery, taking risks can either lead to more profits or a whopping. After all, that has been the routine in recent days and I prefer the latter.
Therefore, I will recommend buying LTC before the end of the week. Traders can wait for a break above the resistance trend line in the 4HR chart-refer the above attachment-or trade as it is.
Already, if today ends up bullish, a double bar reversal bar and its confirmation would be complete in the daily chart. In that case, stops should be at $150 with targets at this March’s highs of $230 assuming prices blast past $200.
NEO/USD (NEO)

As per our previous trade plan, we are still neutral on this pair unless of course there is a strong break out past $75 or the middle BB in the 4HR chart.
Considering price action, chances are that might happen now that there is a bullish engulfing candlestick after periods of brief accumulation.
Aggressive traders can trade with this increasing momentum, buy and place their stops below yesterday’s lows at around $60 on the safe side.
All BitFinex, Bittrex and CoinBase charts courtesy of Trading View


Responses