"Pulse Of The Market" Indicators For Crypto Available ForTradingView
Indicator Package Overview
Our indicator package for TradingView, is the only place in the world where you can gain access to the Wyckoff Wave indicators that include our O-P Index, Force & Technometer. These indicators which are available for purchase at WyckoffSMI/LearnCrypto, are invaluable and required when using the Wyckoff Method to accurately predict market direction. Indicators are updated every 5 minutes throughout the trading day!!
These proprietary indicators will help any trader monitor the markets and gain the edge required in today’s fast-moving markets. Our crypto indicators are based upon “aggregate” data from up to 40 inputs (18 exchanges, 5 stablecoins). So we are getting the majority of volume to analyze as we do here at WyckoffSMI/LearnCrypto.
We have also built a “Wyckoff Sector DashBoard” for stocks and crypto, that will help Wyckoff students find the strong/weak sectors in comparison to the general market indices. This is a must to appropriately apply the Wyckoff method.
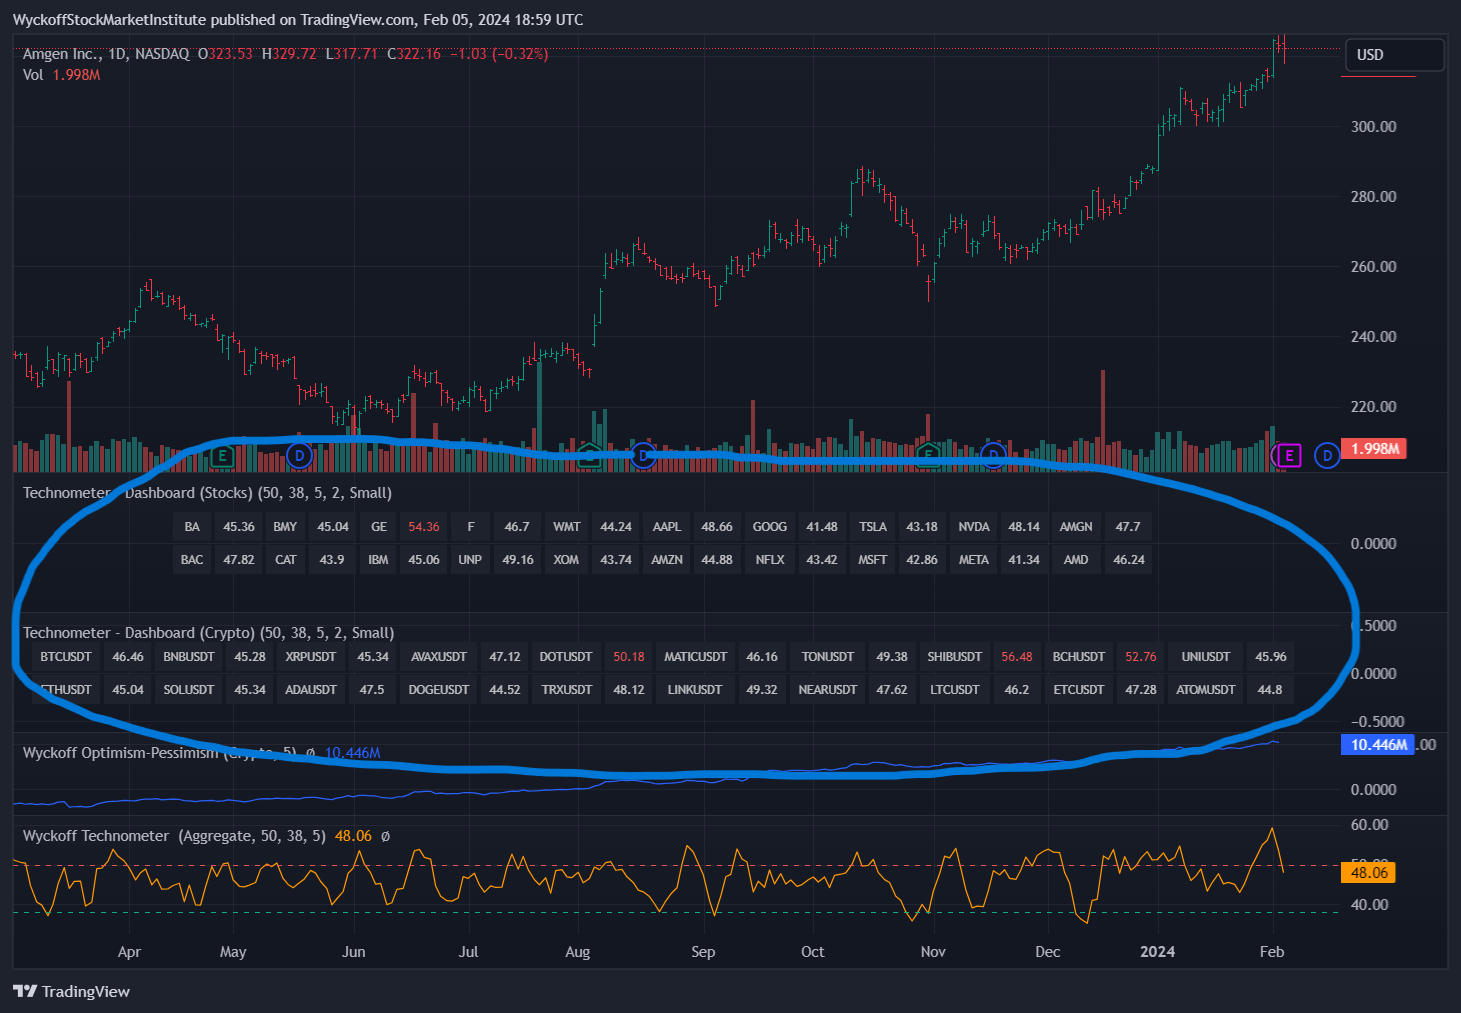
We also include a “Display Dashboard” to easily show up to 20 different stock and crypto Technometer readings at a glance.
With our “Pulse of the Market” indicator package at your fingertips and proper Wyckoff Methods in place, you are sure to increase your chance of achieving success in the cryptocurrency markets.
Click To Enlarge
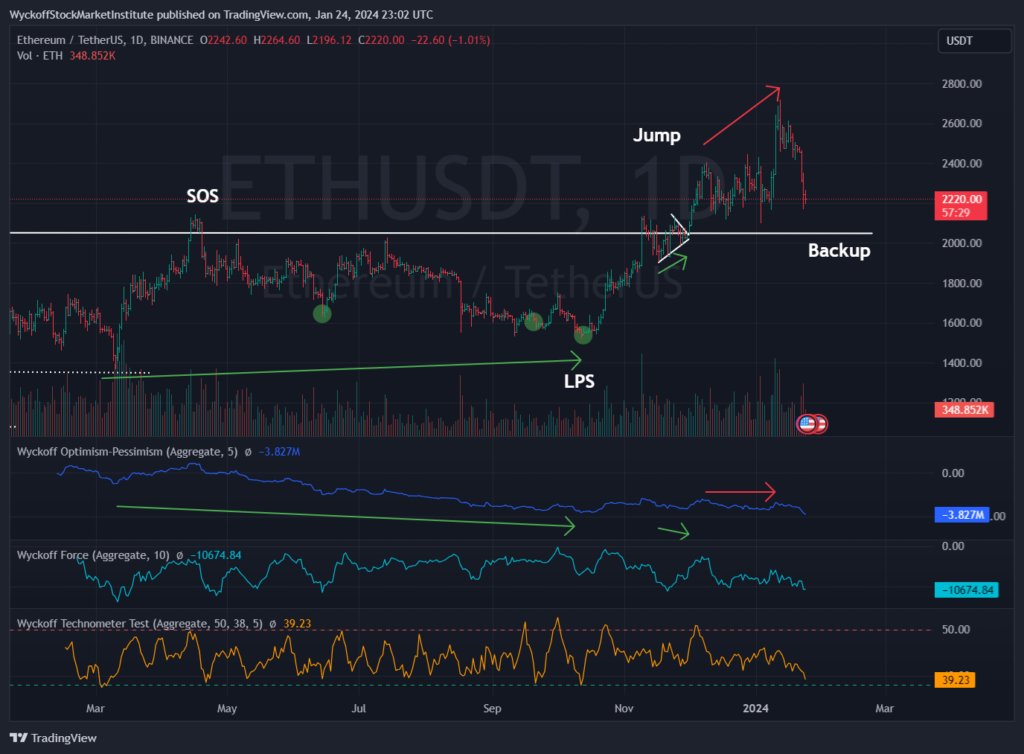
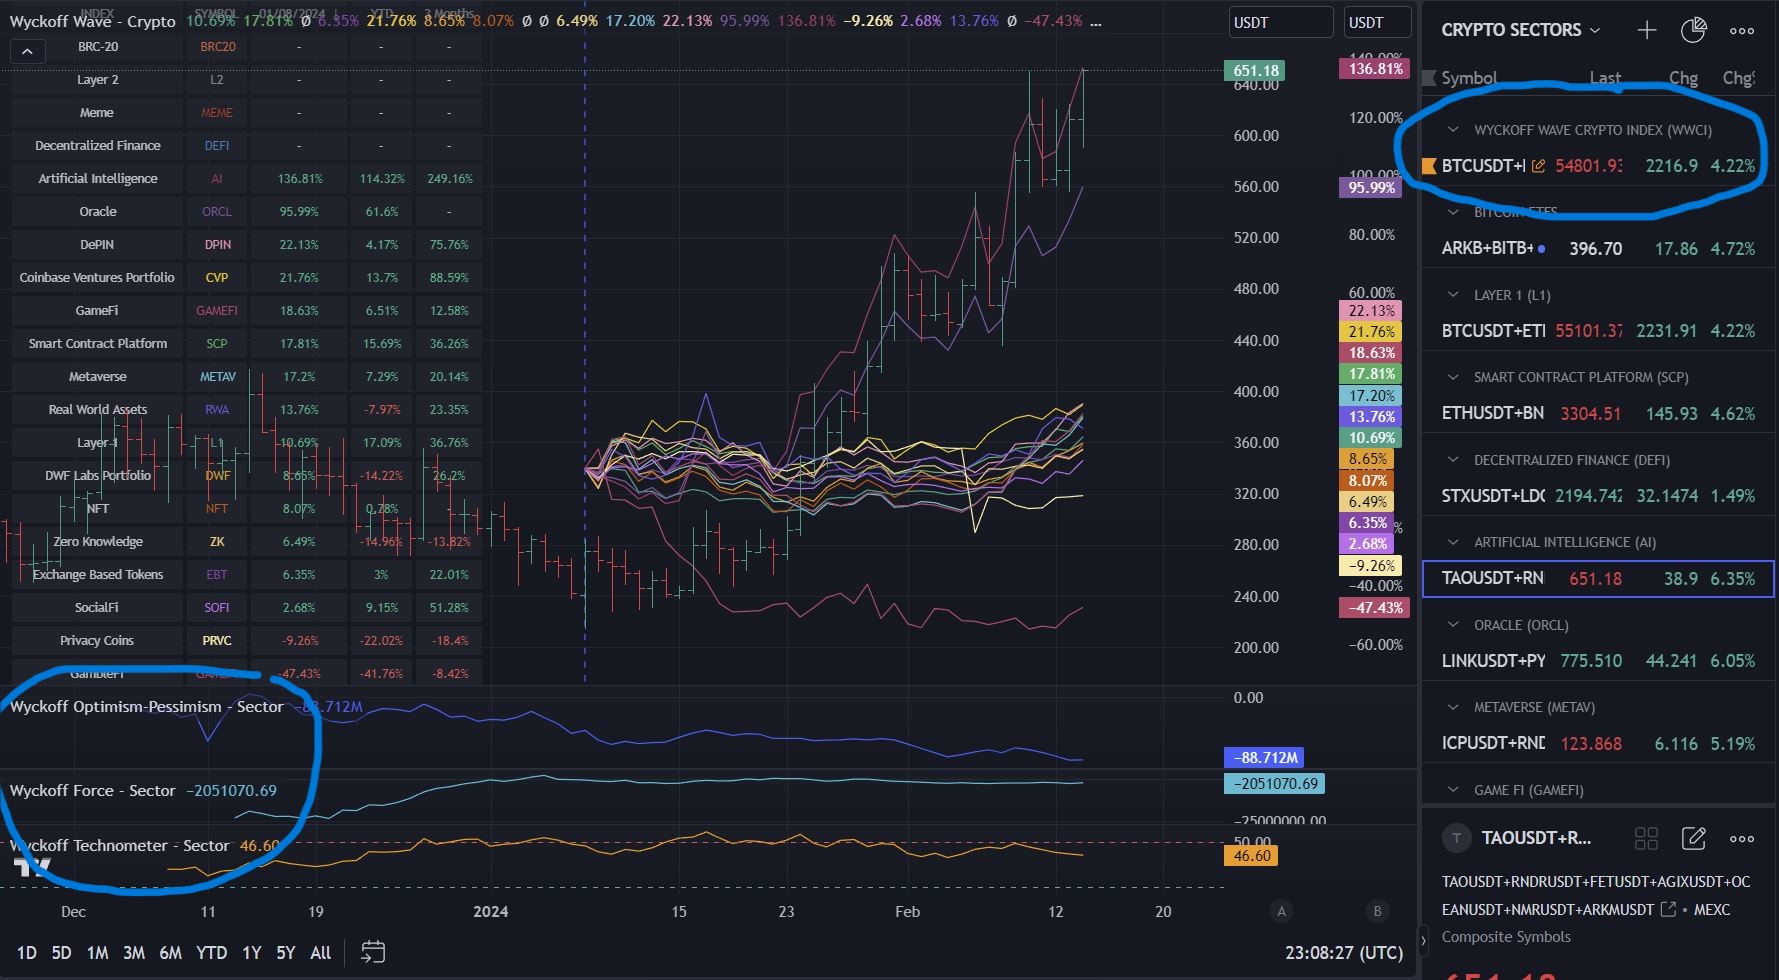
Wyckoff Wave Crypto Index With OP, Force & Technometer
Our Wyckoff Wave Crypto Index with corresponding OP, Force & Technometer help traders recognize overall market direction and identify potential changes of character within the market.
Click To Enlarge
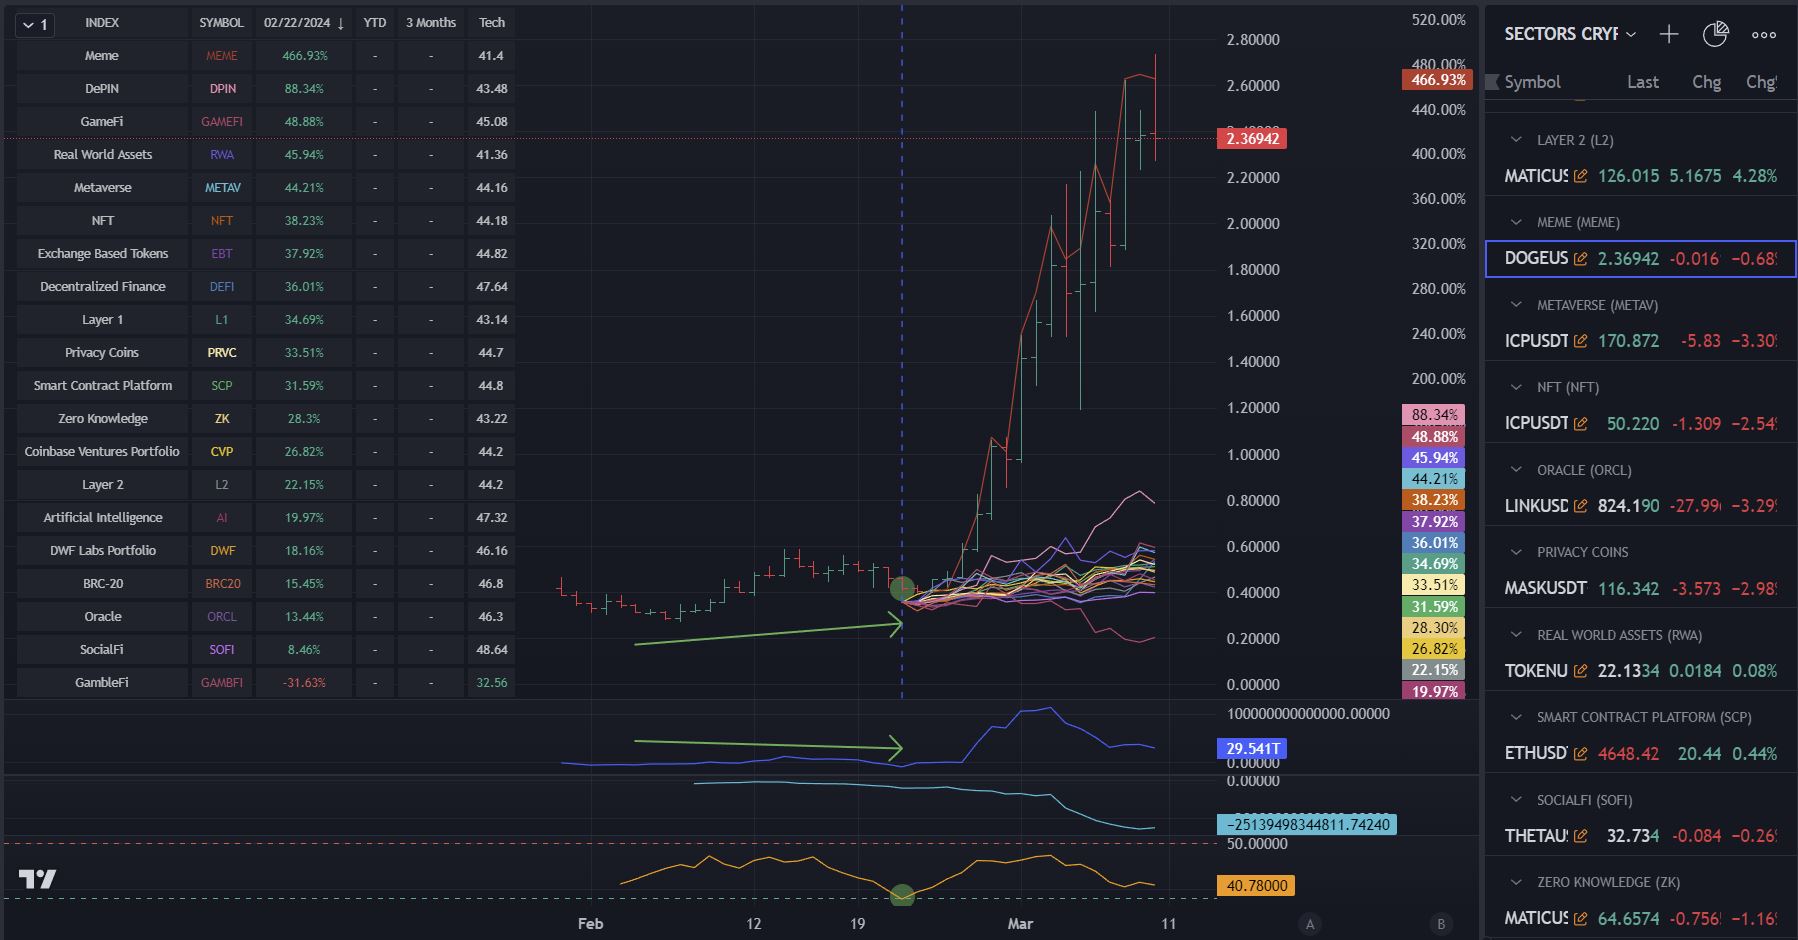
Wyckoff Sector Studies
This chart allows you to quickly identify which Wyckoff Crypto sectors are outperforming or under performing each other or the Wyckoff Crypto Index, at any point in time. These sectors will have their own OP, Force, and Technometer readings, that are also posted on the dashboard.
Click To Enlarge
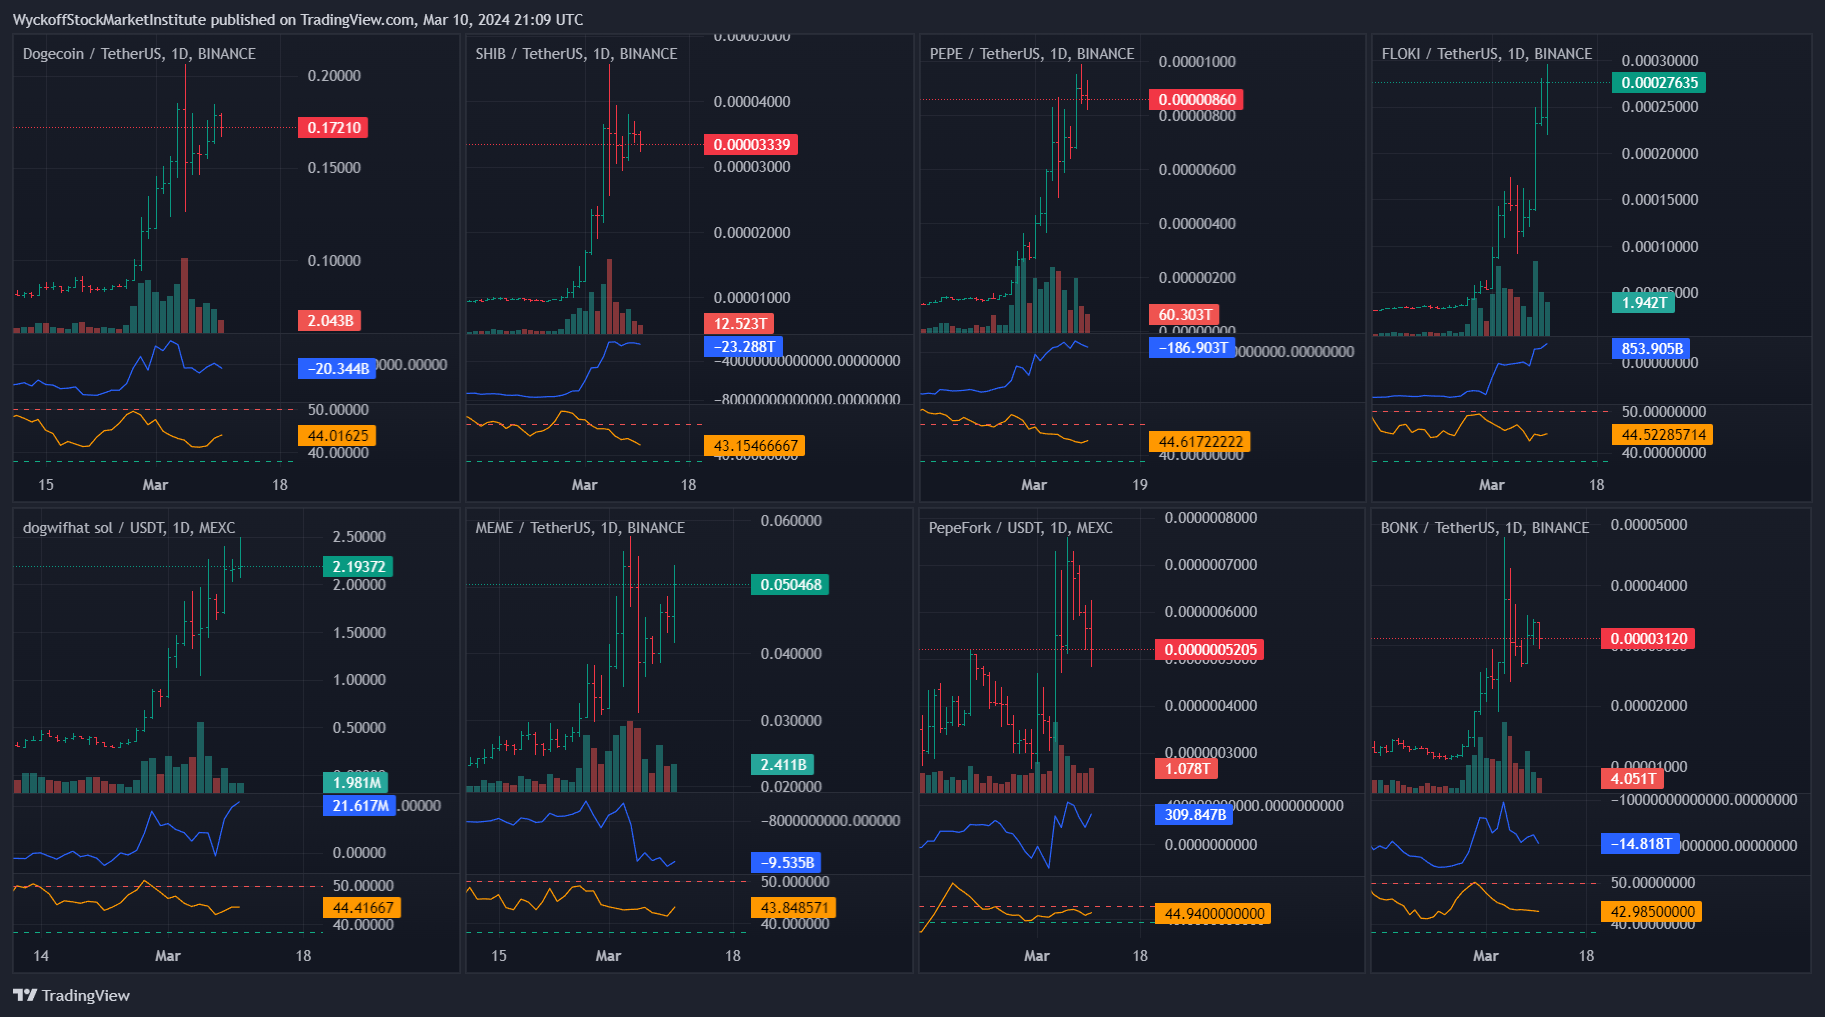
Compare Holdings Chart
TradingView makes it easy to then Compare Holdings of each Sector. We have setup all these Layouts for Subscribers so you can quickly identify how holdings in each Wyckoff Sectors are performing in relationship to one another. This allows you to quickly target underperforming and overperforming holdings.
Click To Enlarge
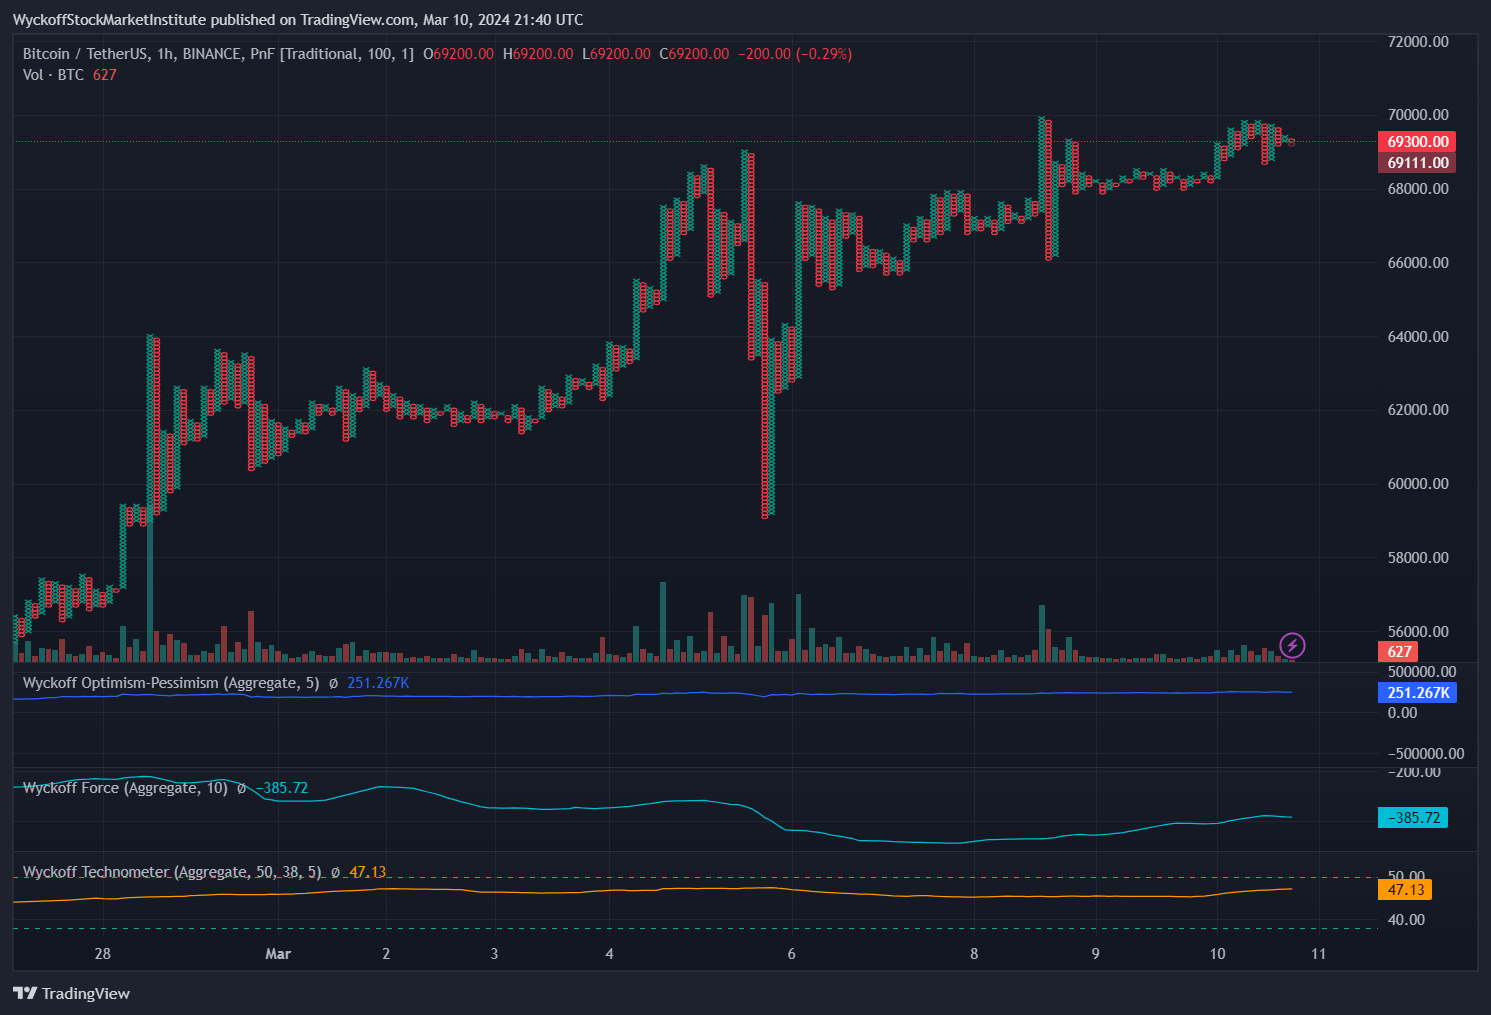
Point & Figure Charts
TradingView charting software allows us to display a point & figure chart as taught in our courses. A point & figure chart is a chart that plots day-to-day price movements without taking into consideration the passage of time. Point and figure charts are composed of a number of columns that either consist of a series of stacked X’s or O’s.
Click To Enlarge
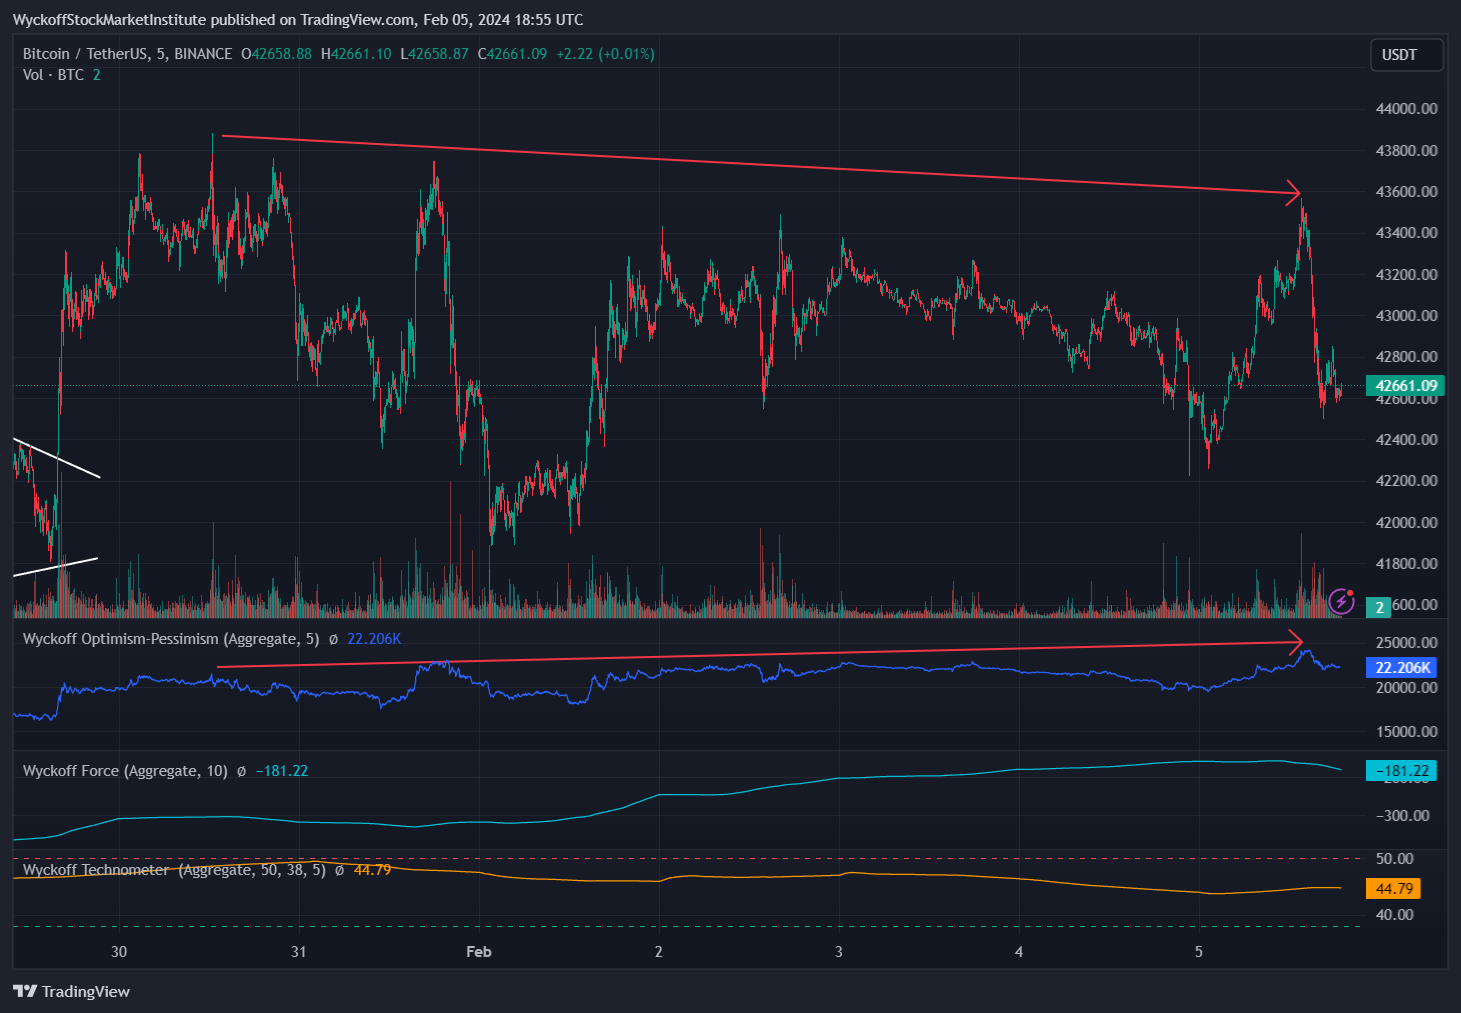
5 Minute Intra-Day Line Chart with our Wyckoff Indicators
This chart helps in the exact timing of taking a position in a stock/crypto. You can easily detect divergences / inharmonious action on an intra-day basis and establish positions accordingly.
Click To Enlarge
Technometer Display
Quickly access Technometer readings for up to 20 stocks and crypto holdings. A great starting point to where to dig in deeper for possible trade setups. No longer is there a need to view every chart to see the Techometer readings.
We use cookies on our website to give you the most relevant experience by remembering your preferences and repeat visits. By clicking “Accept”, you consent to the use of ALL the cookies.
Our website uses cookies to improve your experience while you navigate through the website. Out of these, the cookies that are categorized as necessary are stored on your browser as they are essential for the working of basic functionalities of the website. We also use third-party cookies that help us analyze and understand how you use this website. These cookies will be stored in your browser only with your consent. You also have the option to opt out of these cookies. But opting out of some of these cookies may affect your browsing experience.
Necessary cookies are absolutely essential for the website to function properly. These cookies ensure basic functionalities and security features of the website, anonymously.
Cookie
Duration
Description
cookielawinfo-checkbox-analytics
11 months
This cookie is set by GDPR Cookie Consent plugin. The cookie is used to store the user consent for the cookies in the category "Analytics".
cookielawinfo-checkbox-functional
11 months
The cookie is set by GDPR cookie consent to record the user consent for the cookies in the category "Functional".
cookielawinfo-checkbox-necessary
11 months
This cookie is set by GDPR Cookie Consent plugin. The cookies is used to store the user consent for the cookies in the category "Necessary".
cookielawinfo-checkbox-others
11 months
This cookie is set by GDPR Cookie Consent plugin. The cookie is used to store the user consent for the cookies in the category "Other.
cookielawinfo-checkbox-performance
11 months
This cookie is set by GDPR Cookie Consent plugin. The cookie is used to store the user consent for the cookies in the category "Performance".
viewed_cookie_policy
11 months
The cookie is set by the GDPR Cookie Consent plugin and is used to store whether or not user has consented to the use of cookies. It does not store any personal data.
Functional cookies help to perform certain functionalities like sharing the content of the website on social media platforms, collect feedbacks, and other third-party features.
Performance cookies are used to understand and analyze the key performance indexes of the website which helps in delivering a better user experience for the visitors.
Analytical cookies are used to understand how visitors interact with the website. These cookies help provide information on metrics the number of visitors, bounce rate, traffic source, etc.
Advertisement cookies are used to provide visitors with relevant ads and marketing campaigns. These cookies track visitors across websites and collect information to provide customized ads.
Other uncategorized cookies are those that are being analyzed and have not been classified into a category as yet.
Report
There was a problem reporting this post.
Block Member?
Please confirm you want to block this member.
You will no longer be able to:
See blocked member's posts
Mention this member in posts
Invite this member to groups
Message this member
Add this member as a connection
Please note:
This action will also remove this member from your connections and send a report to the site admin.
Please allow a few minutes for this process to complete.