NEO, EOS, LTC, Monero and Lumens: Altcoins Technical Analysis April 2, 2018

Bitcoin recovery will resuscitate and perhaps lift altcoins from the dredges. Yes, we need that positivity from Bitcoin or ETH but in the mean time, our altcoins technical analysis shows that individual fundamental events from NEO, EOS, LTC, Monero or Stellar Lumens would definitely help.
To begin with, EOS would be under our radar this week with the launch of Dawn 3.0. Okay, there are hints of higher highs but if that would pump prices, then it’s a move we should welcome with open arms.
Let’s have a look at these charts:
XLM/USD (Stellar Lumens)

XLMUSD Daily Chart from Bittrex for April 2, 2018
Even if Stellar Lumens prices are down in the excess of 10%, its ebbs and flow will most depend on fundamental announcements. Stellar Lumens Technical analysis shall only help us fine tune entries at this time when investor sentiment is at rock bottom. Remember that it’s a liquid currency with IBM involvement. In fact, IBM will use the stellar platform to interconnect and ease international payment.
It’s LIVE… – IBM on Stellar Lumens.
Much more in Q2, 2018.https://t.co/EtFLDKV8ua https://t.co/EtFLDKV8ua
— Stellar Lumens (@StellarLumens) March 25, 2018
From the charts, main support lies at $0.20 and prices are slightly below it but here is our Stellar Lumens trade plan. If prices move higher and close above $0.25, we can fine tune long entries on March 3. Our ideal long targets would be $0.40 and $0.40.
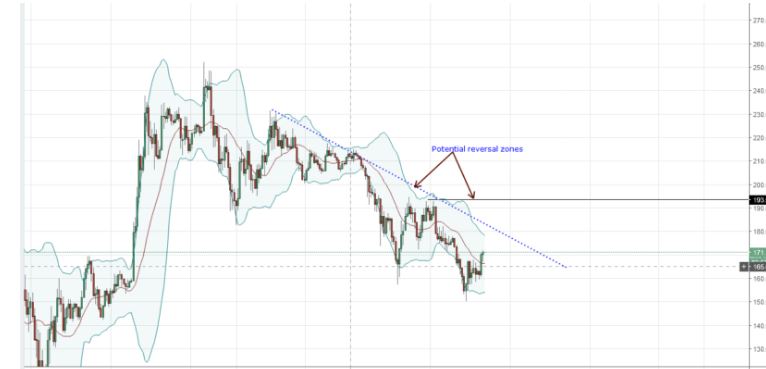
XMR/USD (Monero)

XMRUSD 4HR Chart from Bittrex for April 2, 2018
In 6 months, we shall have a Monero system upgrade. Yes, a hard fork is on the cards too but most people think this MoneroV is another “parasitic” scam made worse by Air drops which requires handing over private keys for them to be available. Anyhow, before prices blow up potentially from superior user experiencewith additions as Kovri, merging of multisigs, bullet proofs and more wallets, we should note that Monero is down but making a recovery.
From our Monero technical analysis, there is a strong bullish engulfing candlestick reversing right from the 78.6% Fibonacci retracement line. Now, unless there is a confirmation today, odds are, prices might inch higher. Already there is a bullish engulfing pattern and if we see sustained highs above $170, buyers can load up their longs and aim for $230 and $250 in the short term.
EOS/USD (EOS)

EOSUSD 4HR Chart from BitFinex for April 2, 2018
As Q1 2018 comes to an end, the bear sores are the only thing tokens have to show. Fundamentally, this token should find support mainly because of Dawn 3.0 launch. This launch is one of the hallmarks of EOS and as it is on its awesome road map, it would show the capability of EOS to support DApp of a commercial level without congesting the platform. If it works as advertised, it should draw some demand especially from developers who might flock and drive the value up.
Dawn 3.0 Alpha Announcement #EOS https://t.co/0oLMj7KUc4
— EOS (@EOS_io) January 26, 2018
Technically, unless otherwise, bears are fattening up and mauling buy pressure. Even though we have this nice bullish engulfing candlestick jutting up from oversold territory, sellers should play ball and wait until a stochastic sell signal prints. As always, there is no need to fade the trend but going with fundamental events, it is likely that prices might trend higher and even test the resistance trend line at $6.3 and higher with limits at $7.3. Aggressive buyers can buy short term and aim for those resistance levels with stops at $5.
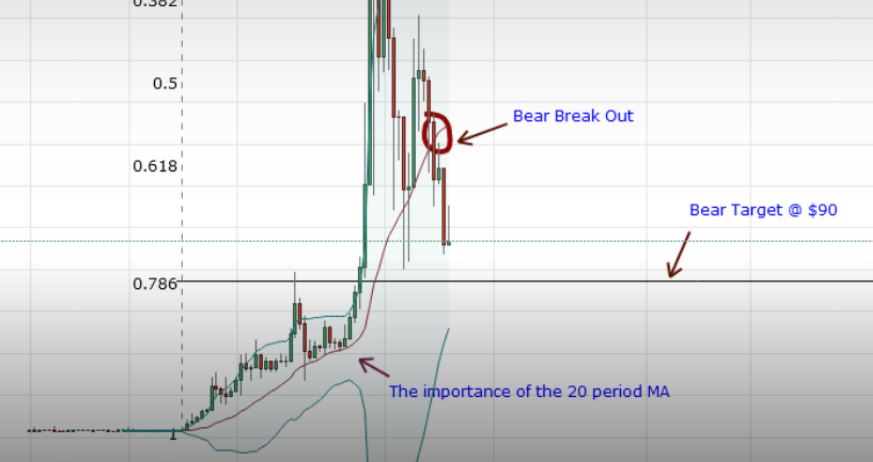
LTC/USD (Litecoin)

LTCUSD 4HR Chart from CoinBase for April 2, 2018
Of course, institutional involvement is still low and once cryptocurrencies including Litecoin gets a global outreach, its value will surely rise.
In the meantime, Charlie Lee should redeem his credibility even if we have Abra’s integration. He should not shill coins without due diligence and right now investors are the one facing the swords.
Even if Abra’s founder Bill Barhydt is adamant that the next bull cycle is around the corner, technical indicators paint a gloomy picture. Anyhow, let’s watch his interview on Wednesday and see what he has to say.
📺Watch me interview Charlie Lee next Wednesday!
❓What questions would you like answered? @SatoshiLite @BitcoinErrorLog @XotikaTV#bitcoin #litecoin pic.twitter.com/jheGDQ1NNs— John Carvalho (@BitcoinErrorLog) April 1, 2018
Technically, we have this small bullish divergence and if prices close above $120, it’s my view that prices might test immediate resistance at $135. That’s $20 away and since we are bearish, any form of a stochastic sell signal printing and turning from overbought territory means sellers can resume their bear moves. The only technical formation that we should be cautious of is a break and a sustained close above the minor resistance line above $140 in the coming sessions.
NEO/USD (NEO)

NEOUSD 4HR Chart from Bittrex for April 2, 2018
Investors want to see useful movement from coin developers and NEO is exactly doing that. There tour begins on Amsterdam from April 4. During that time, NEO will reveal 6 projects they are working with. Remember, this is coming shortly after NEO council released their March report after failing to do so in February.
6 new $NEO projects will be presenting at the NEO ❤ Amsterdam event on April 14th: https://t.co/qdqv9kefHR 🤔🤔
Who’s getting tickets? 🎉$NEO @NEO_Blockchain @NEOnewstoday @NEO_DevCon@Brad_Laurie @lllwvlvwlll @canesin @ByteSizeCapital @boxmining @CryptoLeung@ChicoCrypto pic.twitter.com/hpYLOtfw5P
— Dean van Dugteren (@Deanpress) April 1, 2018
Technically, prices are still moving along the 78.6% Fibonacci retracement line and the failure to dip convincingly towards $40 is indicative of some bull pressure. We can see how stochastics are behaving. Because of this, we can say, picking hints from NEO technical analysis that prices might move especially if there is a confirmation of this bull candlestick. I would recommend long entries with stops at $45 if and only if there is a confirmation. To that end, bulls should aim at $65 and $80 in the short term.
Feature Image courtesy of Pixabay.
All charts courtesy of Trading View


Responses