Magic Number? Chart Data Hints at June 6 Bitcoin Boost

A major reprieve just may be in the offing for the battered bitcoin bulls in the next 36 hours – if, that is, historical patterns repeat themselves.
Intriguingly, the cryptocurrency tends to take a significant change of direction on the sixth day of every month.
Having topped out in the $20,000 neighborhood in mid-December 2017, the cryptocurrency fell to a 2018 low of $6,000 on Feb. 6. Since then, the cryptocurrency has been restricted to a narrowing price range, as indicated by the triangle pattern in the chart below.
What’s more interesting is that major price highs and lows over that time have formed around the sixth day of every month.
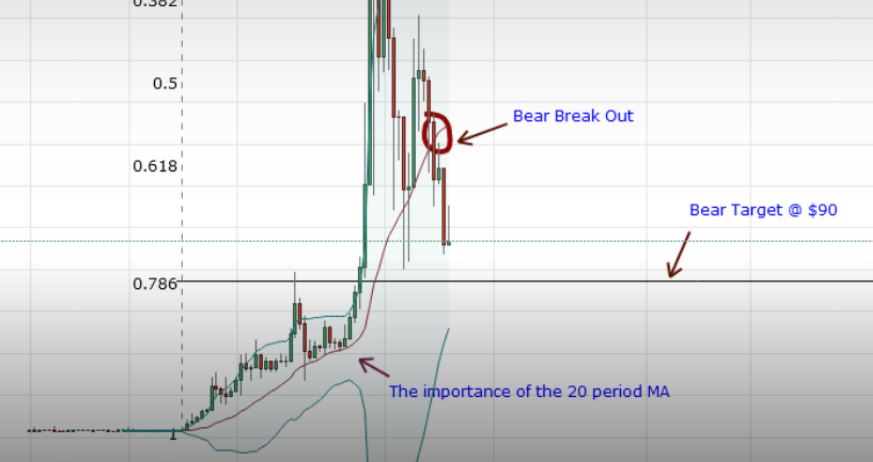
BTC daily chart

The above chart (prices as per Bitfinex) shows:
- Bitcoin bottomed out or turned higher from $6,000 on Feb. 6 and $6,500 on April 6.
- The lower highs – $11,700 and $9,990 – were created on March 5 and May 5, respectively.
- The yearly high of $17,252 was also set on Jan. 6.
Clearly, the tide rebounds in favor of the weaker side on, or close to, the sixth day of every month.
As of writing, bitcoin is trading at $7,433 on Bitfinex – down 34 percent from the bearish reversal point of $9,990, dated May 6, meaning the bulls are currently on the defensive.
Going by the historical pattern, the cryptocurrency seems likely to turn higher in the next 36 hours or so. In this case, bitcoin could revisit triangle (narrowing price range) resistance, currently located at $9,225.
On the other hand, long-term technical studies are biased to the bears, which was not the case on previous occasions.
For instance, the cryptocurrency has found acceptance below the 50-week moving average for the first time since 2015. Further, a 5-month and 10-month moving average (MA) bearish crossoverrecently occurred for the first time in four years.
So, as always, nothing is guaranteed when it comes to bitcoin price movements. But, just possibly, the cryptocurrency could pick up a strong bid tomorrow, in line with the historical pattern.
Even so, it would be too early to call a bull reversal, given the bearish long-term technical developments, and traders would want to see more evidence – such as a high volume break above the weekly high of $7,779 – before assuming the bulls were back in charge.
Calendar image via Shutterstock


Responses