As Bitcoin’s Slide Continues, Prices Look Towards $8K

Bitcoin looks like it might soon test near-$8,000 levels, as December’s record-breaking rally continues to unravel.
With major losses over the last few days seemingly brought about by negative regulatory news from China and South Korea, bitcoin (BTC) is trading at $10,280 levels at time of writing, according to Coindesk’s Bitcoin Price Index.
A slight recovery from the 1.5-month low of $10,064 hit yesterday ran out of steam at $11,698 at 00:20 UTC today, and price once more started to drop. The cryptocurrency has depreciated by 14.35 percent in the last 24 hours, according to data provider CoinMarketCap.
With the indicators still all in bearish territory, the technical charts indicate scope for a drop to $8,000 levels.
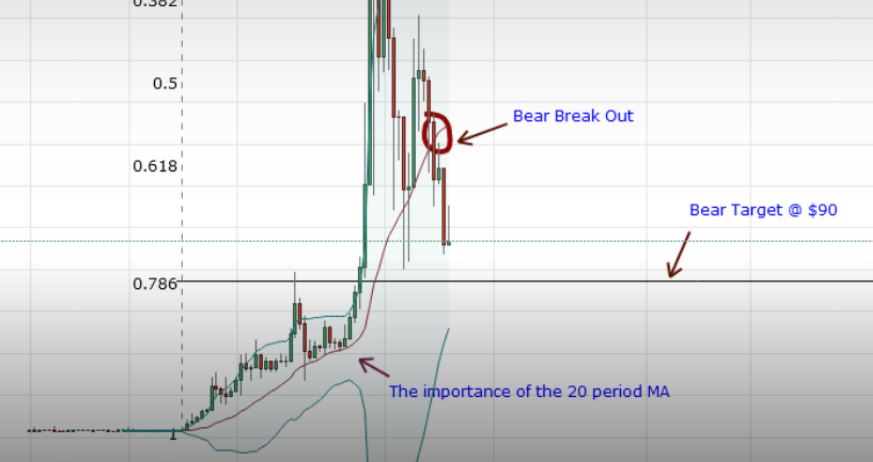
Bitcoin chart

The above chart (prices as per Coinbase) shows:
- Bitcoin closed (as per UTC) well below the Dec. 30 low of $12,500 yesterday, marking a bearish breakdown.
- Bitcoin has breached the support of the ascending trendline (drawn from Sep. 15 low and Nov. 12 low).
- The 5-day and 10-day moving averages (MAs) carry a strong bearish bias (sloping downwards).
- The relative strength index (RSI) also remains bearish.
The above technical factors clearly favor a further drop towards $8,690 – the support of the trendline sloping upwards from Jul. 16 low and Sep. 15 low.
However, the bears are struggling to take bitcoin below $10,313 (50 percent Fibonacci retracement of 2017 rally) in a convincing manner, and yesterday’s dip below that level was short-lived. As for today, prices quickly recovered from the $10,070 (intraday low) to above $10,313.
4-hour chart

As seen in the chart above, yesterday’s long-legged doji candle was accompanied by a surge in trading volumes, indicating strong dip demand at $9,928 (doji candle low).
View
- The broader outlook remains bearish as indicated by the daily chart. Prices look set to test $8,690–$8,052 (61.8 percent Fibonacci retracement of 2017 rally) in the next few days.
- A close (as per UTC) today below $10,313 (50 percent Fibonacci retracement) would boost the odds of a convincing break below $9,928 (4-hour doji candle low) and a slide towards $8,690–$8,052 levels.
- However, a brief recovery to $13,000 levels cannot be ruled out, courtesy of the strong dip demand below $10,000 and an oversold RSI on the 4-hour chart.
- Bullish reversal scenario: Only a close above the descending trend line (drawn from Dec. 17 high and Jan. 6 high) would signal a bullish trend reversal and once more open the doors for $20,000.
Roller coaster image via Shutterstock


Responses