Bitcoin Price Fails To Accomplish Predicted Rally Following NYC Crypto Conference

Bitcoin’s (BTC) price has gone down around 10 percent this week since crypto conference Consensus ended yesterday, May 16, despite predictions that the event would cause the crypto markets to skyrocket.
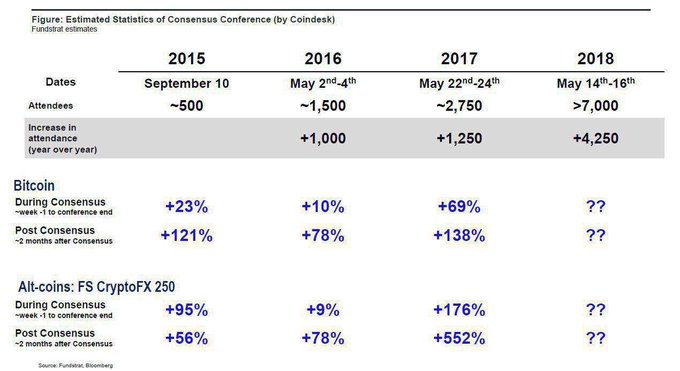
Fundstrat’s Tom Lee, who had accurately predicted a crypto price rise in the wake of US tax day, had used past price spikes after the crypto event to predict a rally “even larger than past years,” according to Bloomberg:
“Bottom line: We expect BTC and cryptocurrencies to behave similarly to prior years and rally during Consensus.”
However, data from Coinmarketcap shows that BTC went from about $8,726 on May 14 to its now current price of about $8,310, a decrease of about 5 percent during the Consensus conference dates, with an overall weekly decrease of about 10 percent.
Bitcoin price chart. Source: Coinmarketcap
A popular crypto commenter Armin Van Bitcoin tweeted last week before the conference a table showing the past price increase of Bitcoin and altcoins both during and post-Consensus, with the column for 2018 left blank. The first questions markets for BTC can now be filled in at around -10 percent, and for altcoins at around -12.8 percent using total market cap data from Coinmarketcap.
Bloomberg Crypto tweeted yesterday, the last day of Consensus, a meme about Bitcoin’s failed rally:
Total market cap has lost about $56 bln this week, down from $438 bln to $382.
Total crypto market capitalization. Source: Coinmarketcap
Ethereum (ETH) has also dropped, trading at around $700 after this week’s high of about $759, and down about 1 percent over a 24 hour period to press time.
Ethereum price chart. Source: Cointelegraph Ethereum Price Index
Altcoins are a mix of red of green, with most of the top ten altcoins on Coinmarketcap showing almost 0 percent growth or loss over a 24 hour period to press time.
Market visualization from Coin360


Responses