
Key Points
- Bitcoin price is placed nicely above the $7,200 level with positive signs against the US Dollar.
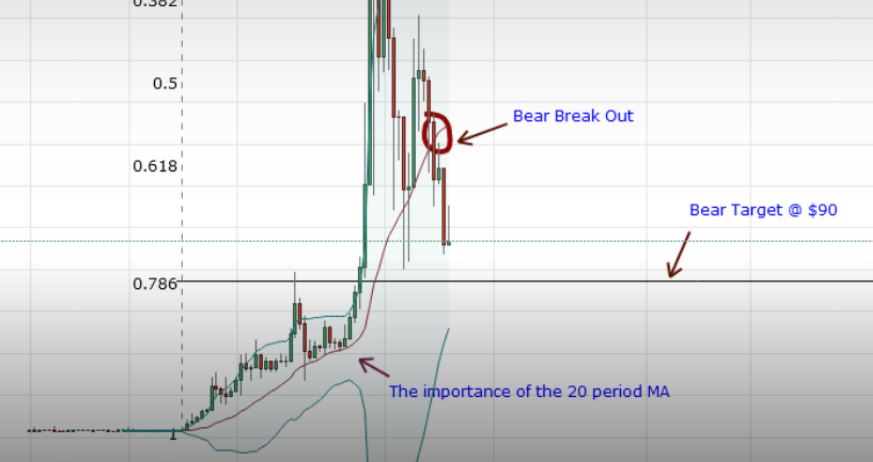
- There is a key bearish trend line in place with resistance at $7,750 on the 4-hours chart of the BTC/USD pair (data feed from Kraken).
- The pair must accelerate gains above the $7,750 and $7,800 barriers for more upsides in the near term.
Bitcoin price is moving in a bullish zone above $7,200 against the US Dollar. BTC/USD may perhaps clear the $7,800 resistance to jump above $8,000 in the near term.
Bitcoin Price Resistance
This past week, bitcoin price mostly traded in a range above the $7,000 handle against the US Dollar. The best part was the fact that the price stayed above the $7,200 and $7,400 support levels. There was also a break and close above the 23.6% Fib retracement level of the last drop from the $8,613 high to $7,050 swing low. There are positive signs, but there is a crucial barrier around the $7,800 level.
However, the upside move is capped by the $7,780 and $7,800 levels. More importantly, there is a key bearish trend line in place with resistance at $7,750 on the 4-hours chart of the BTC/USD pair. The 50% Fib retracement level of the last drop from the $8,613 high to $7,050 swing low is also around the trend line. Therefore, there is a major hurdle forming for buyers just around $7,800. A break and close above $7,800 may perhaps clear the path for a push above the $8,000 level.

Looking at the chart, the price is mostly trading in a range with a bearish angle below $7,500. If sellers gain control and push the price below $7,200, there could be a bearish reaction in the short term.
Looking at the technical indicators:
4-hours MACD – The MACD for BTC/USD is mostly flat in the bullish zone.
4-hours RSI (Relative Strength Index) – The RSI is just below the 50 level.
Major Support Level – $7,200
Major Resistance Level – $7,800


Responses