Stellar Run Ahead? XLM Flirts With Price Breakout

Having rallied 25 percent in the last 24 hours, Stellar’s XLM token is now eyeing a bullish breakout on the price charts.
As of writing, XLM is changing hands at $0.57, according to data from OnChainFX. The cryptocurrency is up close to 100 percent compared to last week’s low below $0.30.
Twenty-four-hour trading volume stands well over $0.5 billion – the highest level since Jan. 5, according to CoinMarketCap. The sharp rise in volume indicates strong hands are at play and the price rally could have legs.
Furthermore, a look at the individual markets shows that investors are likely using bitcoin (BTC) to accumulate XLM. For instance, the XLM/BTC pair on Binance is up 18 percent, while volumes have increased by 10 percent.
While, XLM is still down 37 percent from its all-time high of $0.9381 set on Jan. 4, the price chart analysis indicates there is scope for a re-test of record highs in the near-term.
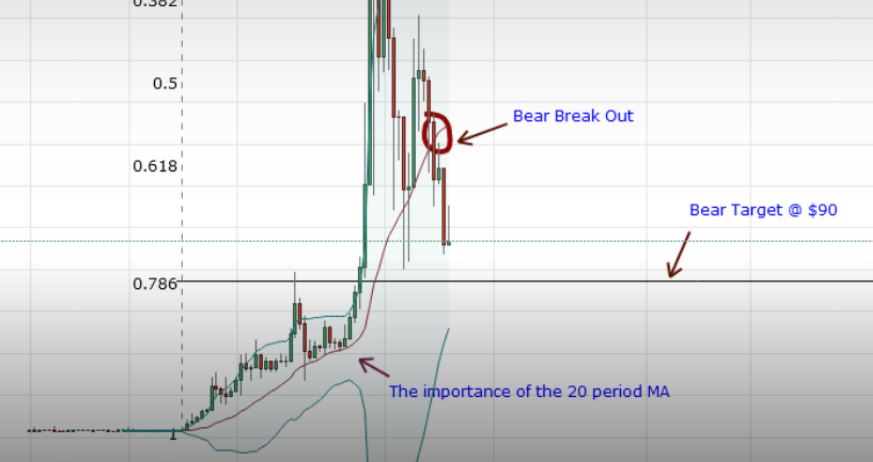
XLM chart

The above chart shows:
- Bull flag pattern: A close today (as per UTC) above $0.525 would confirm an upside breakout.
- The relative strength index (RSI) has turned higher from a neutral level (50.00), suggesting scope for a rally.
- Higher lows as indicated by the (blue) ascending trendline.
A bull flag breakout would indicate the pullback from the record highs above $0.90 has ended and the rally from the Dec. 28 low of $0.1774 has resumed.
View
- A close above $0.525 would open doors for $1.20 (target as per the measured height method – the difference between flag high and low added to breakout price).
- On the way higher, XLM could face resistance at $0.7415 (Jan. 13 high) and $0.9823 (December high).
- On the downside, a major bearish move would be seen only if prices drop below $0.39 (Jan. 22 low).
Broken glass image via Shutterstock


Responses