Ripple Price Drops to 2.5-Week Low, Eyes Sideways Trading

Ripple’s XRP token fell to a 2.5-week low today, and is looking at a more or less sideways movement in the short-term, chart analysis suggests.
The world’s third-largest cryptocurrency by market capitalization fell to the low of $1.23 at 09:54 UTC today before regaining a little poise, data source CoinMarketCap indicates. Further, XRP is still down 23 percent over the last 24 hours. As per OnChainFX, the cryptocurrency is down 63.41 percent from the record high of $3.84 set Jan. 4. At press time, XRP is trading at $1.39.
4-hour chart

The above chart (prices as per Bitfinex) shows:
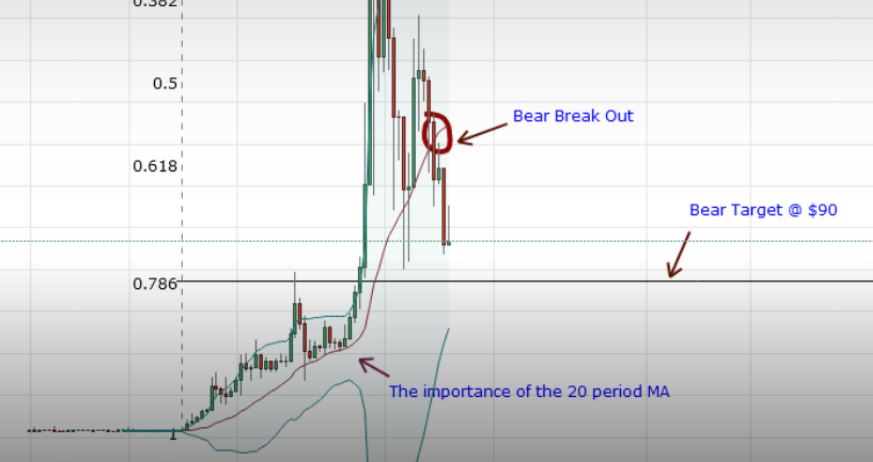
- Dip demand/bearish exhaustion as indicated by the Doji candle (previous 4-hour candle marked with a circle).
- A head-and-shoulders breakdown (bearish reversal pattern) indicating the rally from the December low of $0.19700 has ended. As per the measured height method, that has opened doors for a drop to $0.30 (though that looks far-fetched currently).
- 50-day moving average (MA) has adopted a bearish bias (sloping downwards).
- Bearish 50-day and 100- day MAs crossover is confirmed (short-term average cuts long-term average from above).
- 200-day MA has shed bullish bias (flattened).
Clearly, the 4-hour chart is loaded with bearish price patterns that indicate scope for a drop to $0.8610 (78.6 percent Fibonacci retracement). However, the relative strength index (RSI) on the chart above shows oversold conditions.
Daily chart

As seen in the chart above, the 5-day and 10-day MAs have adopted bearish bias (sloping downwards). The RSI also favors further downside in XRP. The tide has clearly turned in favor of the bears.
However, the 50-day MA is curled up in favor of the bulls. This coupled with the oversold conditions on the 4-hour chart (as shown by the RSI) and the doji candle on the 4-hour chart could keep XRP rangebound in the next 36–48 hours.
The 50-day MA would shed its bullish bias (top out) following a bout of consolidation, thus opening doors for further losses.
View
- XRP is likely to trade in the sideways manner in the range of $1.80 to $1.00 in the next day or two, before resuming the sell-off.
- Overall, prices look set to $0.8610–$0.60 levels in the short-run.
- Bullish scenario: A rebound from the 50-day MA, followed by a quick move above $2.25 (Jan. 11 high) would signal a bearish-to-bullish trend change.
Ripples image via Shutterstock


Responses