Bull Trap? Bitcoin Cash Price Is Up, But Gains May Be Short-Lived

Bitcoin cash (BCH) is well bid today, but a close look at the numbers indicates the positive move could be deceptive.
Prices dropped for the third straight day yesterday, signaling a transient victory for the bears in the ongoing tug of war with the bulls.
Looking like it would head lower towards $850 (Nov. 17 low) earlier today, bitcoin cash instead regained the bid tone and rallied as high as $1,550 before trimming gains. The world’s third-largest cryptocurrency by market value was last seen trading in the $1,450 neighborhood, as per data provided by CoinMarketCap.
So, was yesterday’s breakdown a “bear trap,” or is the positive price action seen today a case of “bull trap”? Only a close today (as per UTC) above $1,545 (161.8 percent Fibonacci extension) would be bad news for the bears.
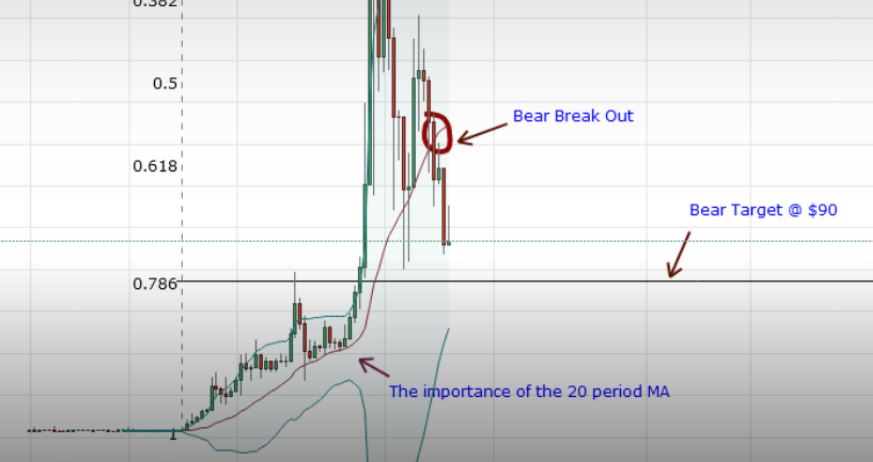
Bitcoin cash chart

The above chart shows:
- Bitcoin cash suffered a downside break of the rising channel (marked by blue channels) and a bearish symmetrical triangle breakdown yesterday.
- The relative strength index (RSI) fell below 50.00 into bearish territory yesterday, possibly signaling more losses ahead.
- BCH ran out of steam at $1,545 earlier today and fell back to $1,350 levels.
- The decline from $1,545 to $1,350 also marks a failure to hold above the 5-day and 10-day moving averages (MA).
- Further, the 5-day MA and 10-day MA are sloping downwards in favor of the bears.
Further, the market usually crowds out weak hands (bear or bull) following a major move in prices.
The observed bearish rising channel breakdown and a bearish symmetrical triangle breakdown both indicate a bullish-to-bearish trend change – i.e. the rally from the October lows below $300 may have topped out.
And the move higher seen today could have taken out the weak hands – i.e. bears with tight stops (and, hence, low-risk tolerance).
View
- Chart analysis suggests bitcoin cash is more likely to break below $1,280 (rising channel support) in the next 24–48 hours and confirm that today’s spike was a bull trap. Prices could then test support at $850 (Nov. 17 low) in the short-run.
- On the higher side, only a close (as per UTC) above $1,545 would revive the bull run.
Traps image via Shutterstock


Responses