Bitcoin Buy Volume Reaches Record High on Binance, Intense Demand

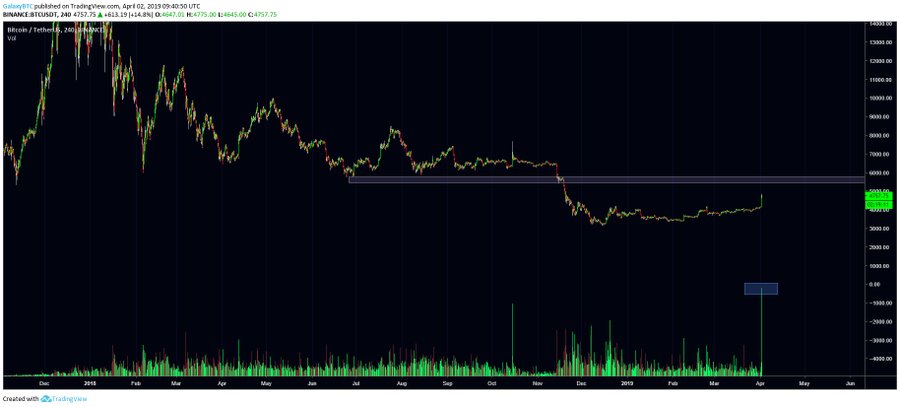
The Bitcoin trading volume on Binance established a historic high as the asset price jumped more than 15-percent within an hour.
The global cryptocurrency exchange posted its best four-hour timeframe volume statistics this Tuesday, reporting as high as 49,103 buy orders alongside 5,655 sell orders. The latest upside wave broke the record of the October 15 trading session, in which the buy volume had touched 40,315 and sell order was mere 5,331.
The situation was similar in the case of Etherum. The second-largest cryptocurrency by market capitalization dropped 6.74 percent against the bitcoin on Tuesday. Meanwhile, the ETH/BTC volume noted a record volume jump on a four-candle timeframe – however, more to the selling side. Binance noted 250,222 buy orders and 39,670 sell orders between 00:00 UTC and 04:00 UTC.
Bitcoin on a whole established a fresh four-month high towards $4842.42. Meanwhile, Ethereum formed lower lows towards 30,599 satoshis.
Interim Sentiment Indicator
The increasing buying orders on Binance, which is the world’s largest cryptocurrency exchange by volume, serves as a yardstick for bitcoin’s bullish bias in near-term. Traders are inclined to join strong upside movements and their interest in taking parts in selling movements is less. If a price rise comes with a rise in volume, then it is a strong bullish indicator. However, if the bitcoin price maintains its gains and volume starts declining, then it could be a warning of a potential reversal.
The best metric to test the current bitcoin bias is a daily chart. Let’s have a look:
We drew a trendline adjoining the apex of recent high daily volumes with a bias towards bulls. Each of the candle mentioned in the chart above noted a daily surge up to $1,400, coupled with an increase in volume. One can notice that Binance didn’t exactly establish a record trading activity during the ongoing bitcoin rally on daily charts. One can also notice that bitcoin price had impressive daily sessions despite remaining in an overextended bearish bias.
For instance, Candle 1 and Candle 2 noted almost the same daily volume as experienced by current candle formation. The bitcoin price rose up to establish higher lows but later rebounded. Candle 3, which saw the bitcoin price jumping from $6,295 to $7,700 in a day, didn’t maintain the bullish momentum at all. The price went sideways and eventually crashed towards $3,100-$3,200 range.
Bitcoin Breakout
The only justification that the ongoing rally could end up ballooning more is the breakout. Bitcoin was unable to break through a medium-sized descending trending for a very long time. The market noted failed attempts, followed by complete trend reversals. But this time, bitcoin has invalidated the trendline in the last daily sessions. Couple that with an increase in volume and we have a strong medium-term bullish sentiment.


Responses