Altcoin Analysis: NEO, EOS, LTC, NEM and Lumens
There is a clear stochastic buy signal turning from deep the oversold territory in NEO, LTC, Lumens, NEM and EOS/USD charts and this of course means buyers are now entering the trade.
If this momentum amounts to something, then we expect prices-especially in LTC/USD to surge past $170 as buyers look to buy at every low.
Let’s have a look at these charts:
XLM/USD

From yesterday’s Lumens price action, we can see that bulls were actively pushing prices higher and that is an awesome development.
Now, what we need is for this week’s candlestick to end up strongly and that means buyers must close above our buy triggers at set at $0.55 or the key Fibonacci retracement line at 61.8%.
In fact momentum wise, we expect that to happen now that momentum is shifting from oversold territory with a clear buy signal after yesterday’s bullish candlestick.
If that happens, then on February 11, buyers can begin buying on any retracement in their lower time frame of choice of which I recommend the 1 or 4HR charts.
XEM/USD

Now, our buy triggers are now active and we should be looking to spread out our long entries today.
Notice that after yesterday’s bullish candlestick, NEM prices ended up trending above the 61.8% retracement level complete with a stochastic buy signal turning from deep down the oversold territory of the stochastics.
Often, such developments is triggers bull surges as historical prices shows and therefore we shall not brush off NEM prices testing the middle BB today or even before the end of the week.
If there is nothing that can be liquidation-or out of the ordinary fundamental development, then I recommend buying at every low or retest of $0.55.
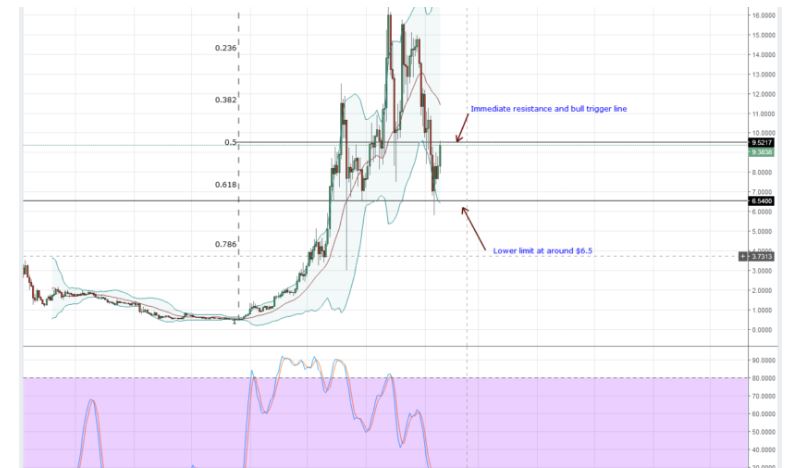
EOS/USD

EOS prices are bullish and buyers are testing our main resistance line at $9.5.
Of course, this is in line with our yesterday’s forecast and all that we want is a confirmation of yesterday’s bullish pressure and as the week concludes a close above $9.5 is desirable.
In my opinion, prices are likely to snap back and continue with the main bull trend now that we have this shift of momentum from bearish to bullish following that clear stochastics buy signal.
Remember, it’s a guide and not a reason to buy or sell because it is a lagging indicator. Anyhow, I recommend buying on every dip in the 1 or 4HR charts.
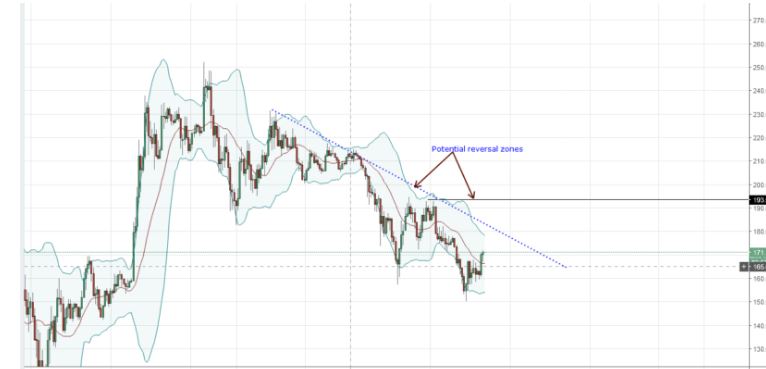
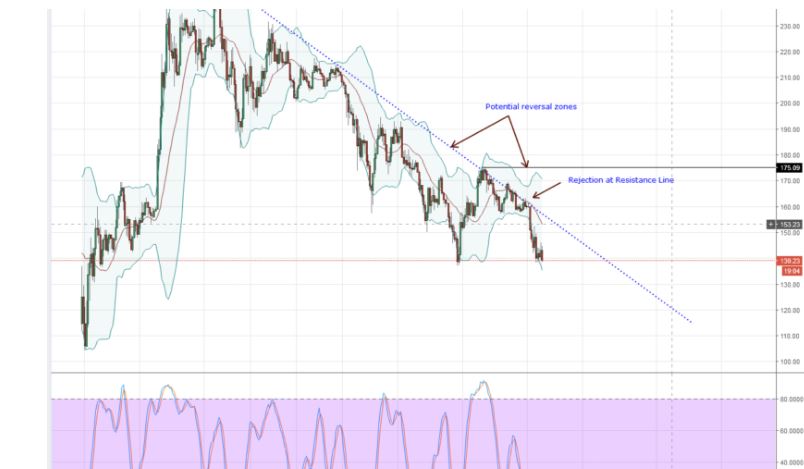
LTC/USD

LTC is $10 shy from our main resistance zone of $170.
Since we now have that strong bullish candlestick, all we need today is a thrust across this level before we start picking out buy signals in subsequent sessions. It’s that simple.
Furthermore, apart from this bull candlestick, bullish momentum is increasing with a clear buy signal.
NEO/USD

Little by little, NEO continues to inch higher and that is despite yesterday’s sell pressure in lower time frames.
Nothing much has changed and today, we shall see if the doors for a close above the middle BB and $130 are open.
Scalpers can look for buy opportunities and place their stops at around $100 or yesterday’s lows.
All charts courtesy of Trading View


Responses