Wyckoff Wave Still Trading Constructive…

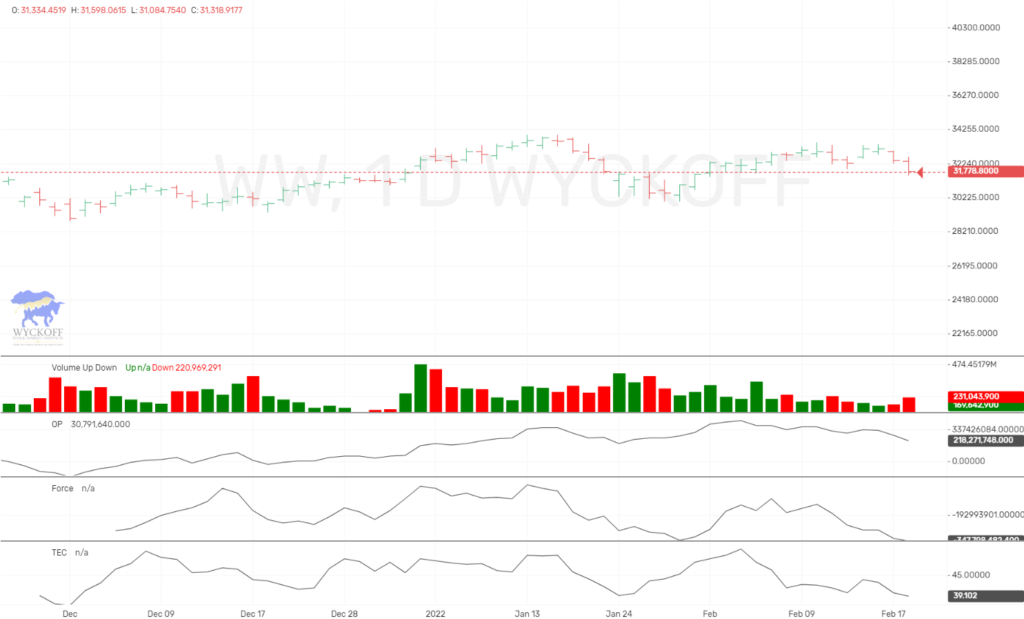
The Wyckoff Wave traded higher for the week, on average volume.
We was looking at a possible “last point of support” ending, and was looking for a continuation of the rally. We did get this last week, and it appears we can still get more upside action in the weeks ahead.
Our Technometer is did register near overbought on Thursday, and backed off some Friday. We would like to see it back to neutral/oversold to allow us a solid rally.
Technometer is near neutral/overbought at a reading of 47.5.
The Wyckoff Wave touched a high Thursday while the OP lagged. This set us up for some short-term corrective action.
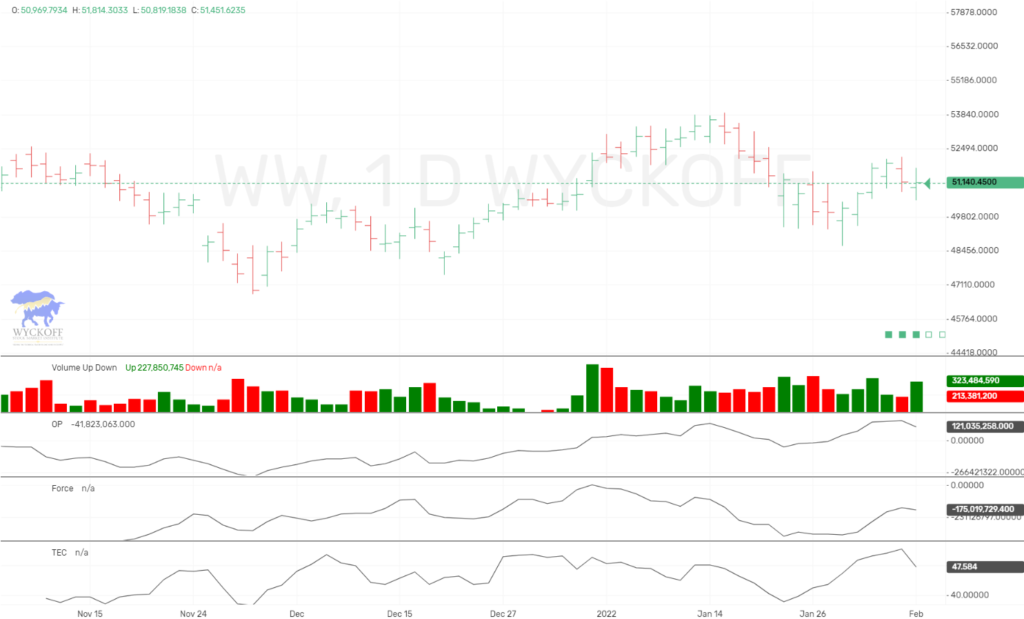
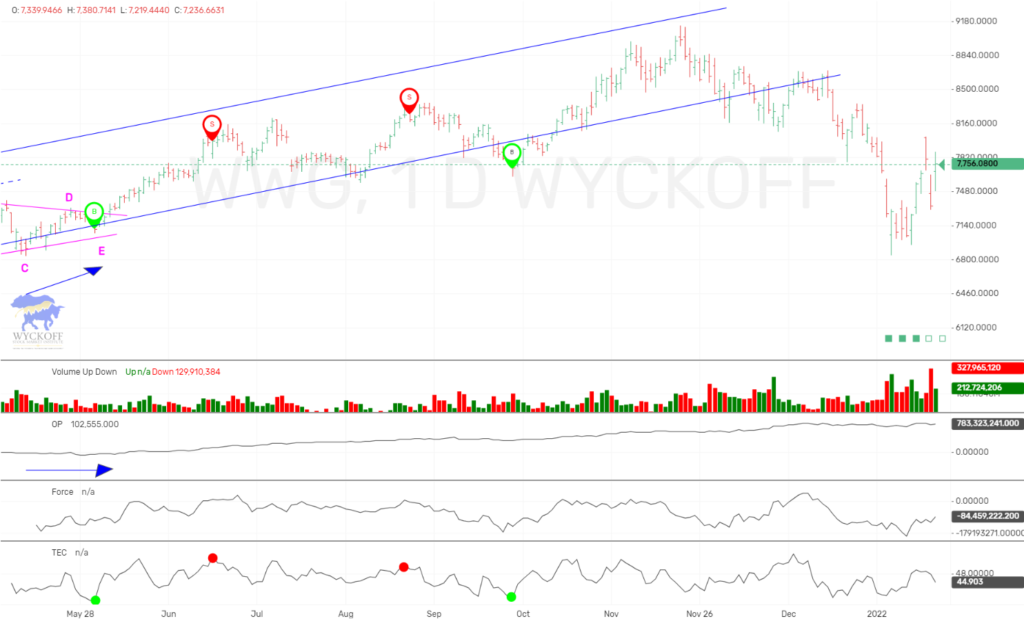
The Wyckoff Wave Growth Index ended the week up nicely, and volume was average.
The WWG index had a nice rally off of last’s week test of the low. We continue to stay bullish and look for higher price action. Technometer is neutral and will allow for higher prices before becoming overbought.
Technometer is now neutral with a reading of 44.9.
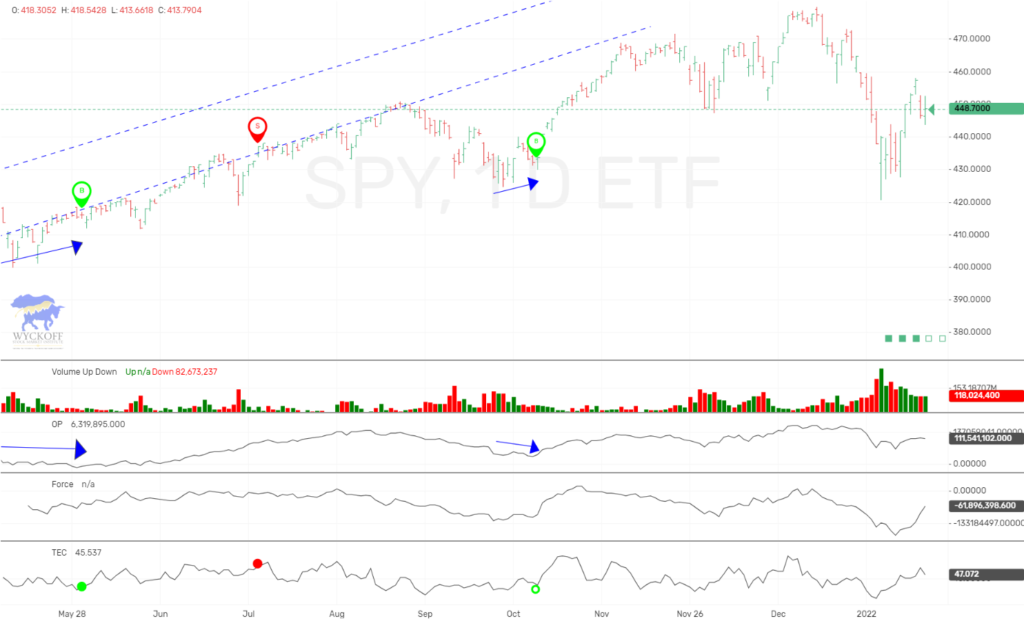
The SPY closed the week higher as well, on average volume.
We was wanting continued upside action here as well, and we got it. The SPY had a nice rally early in the week, and held its gains into the weekly close. We look for possible sideways in this area, then higher.
The Technometer is above neutral at a reading of 47.07.
If you want more current up to the minute updates and trades as shown above, please join our ProTraders/Private Stock Discord. Join Here
If you are a Crypto Discord Member, and would like the ProTraders/Private Stock Discord as well, you can have access for only $20 a month. Join Here
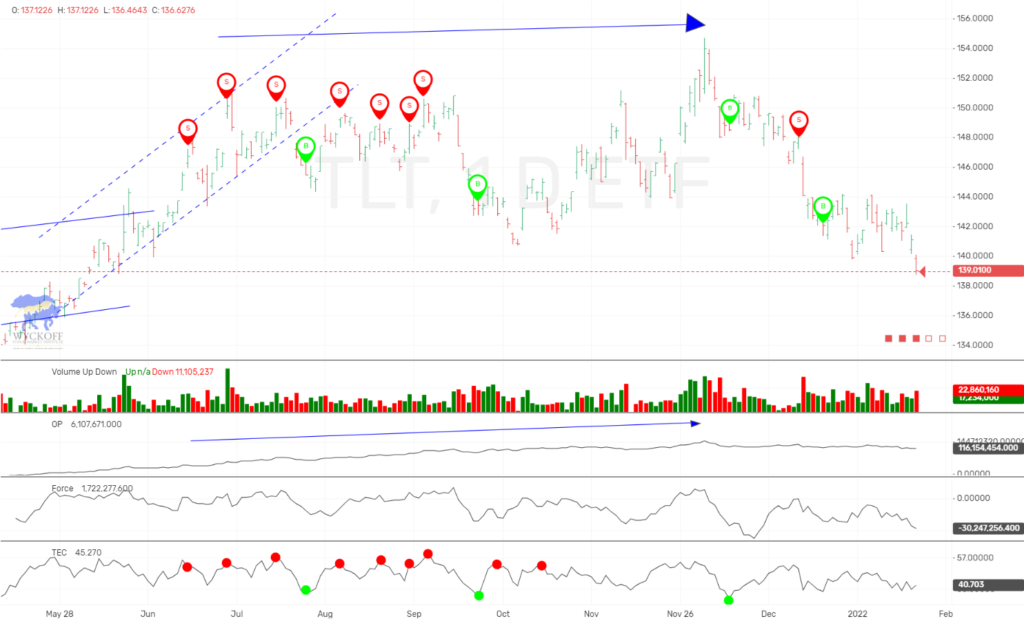
The bond market closed sharply lower for the week, against our thoughts. We would be on the lookout for a spring here, since we have an oversold Technometer. We are on the sidelines.
The Technometer is near oversold with a reading of 40.7.
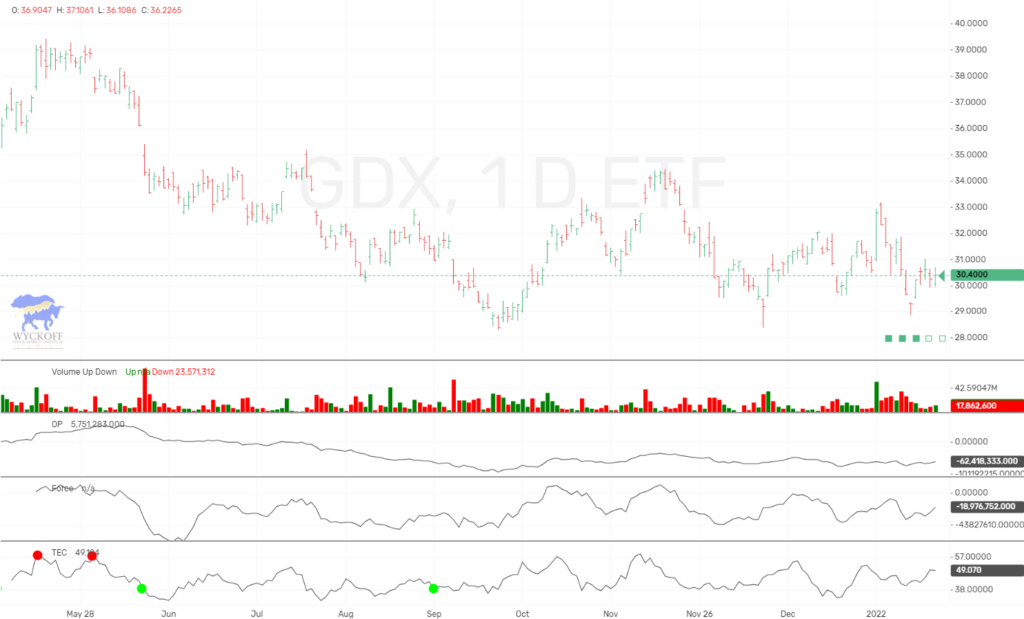
The GDX closed the week higher, off of the weak dollar. Volume was much lower for the week.
The Technometer is overbought, but we are on the sidelines.
Technometer is near overbought with a reading of 49.
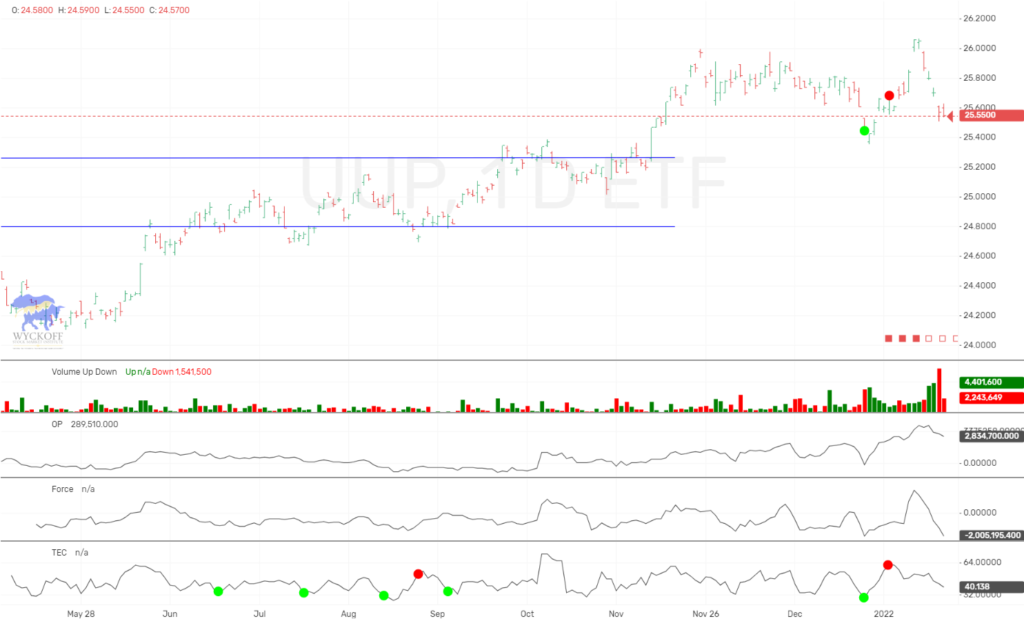
The long dollar ETF, UUP closed sharply lower on much higher volume.
We was looking for the Dollar to upthrust the highs, which it quickly did. The action looks bearish and we expect much lower from here.
The Technometer is near oversold with a reading of 40.14.
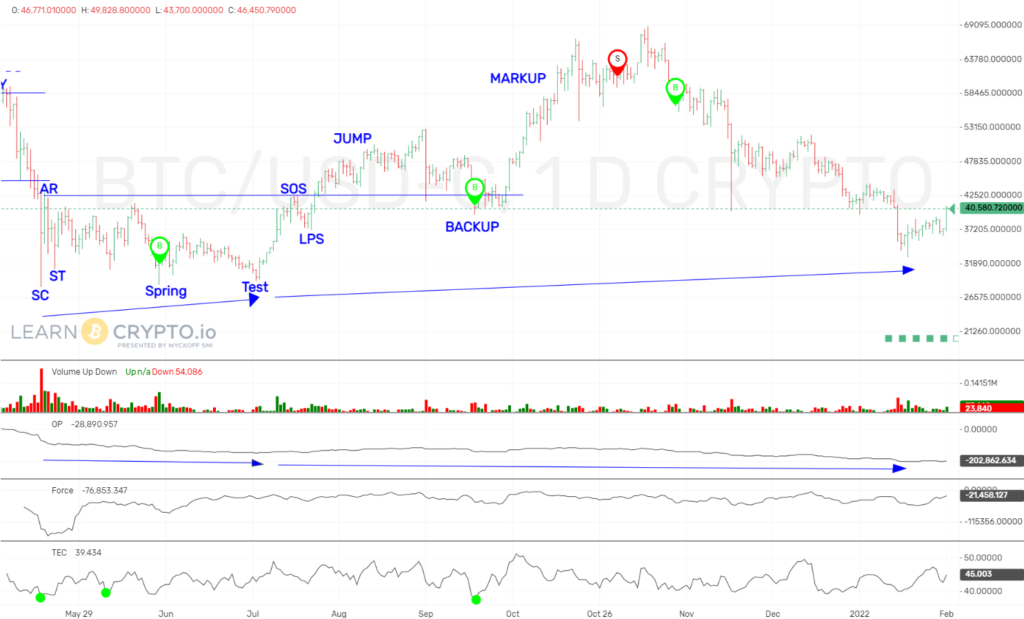
Bitcoin had a strong rally on Friday. We had been expecting Bitcoin to follow the Nasdaq higher, and Friday was kind of a catch up move. Sentiment has been too bearish, and we expect still higher.
You can see at the most recent low, the OP had went to new lows below the May-July lows. This is a bullish divergence, with sell pressure increasing while price holds a higher low.
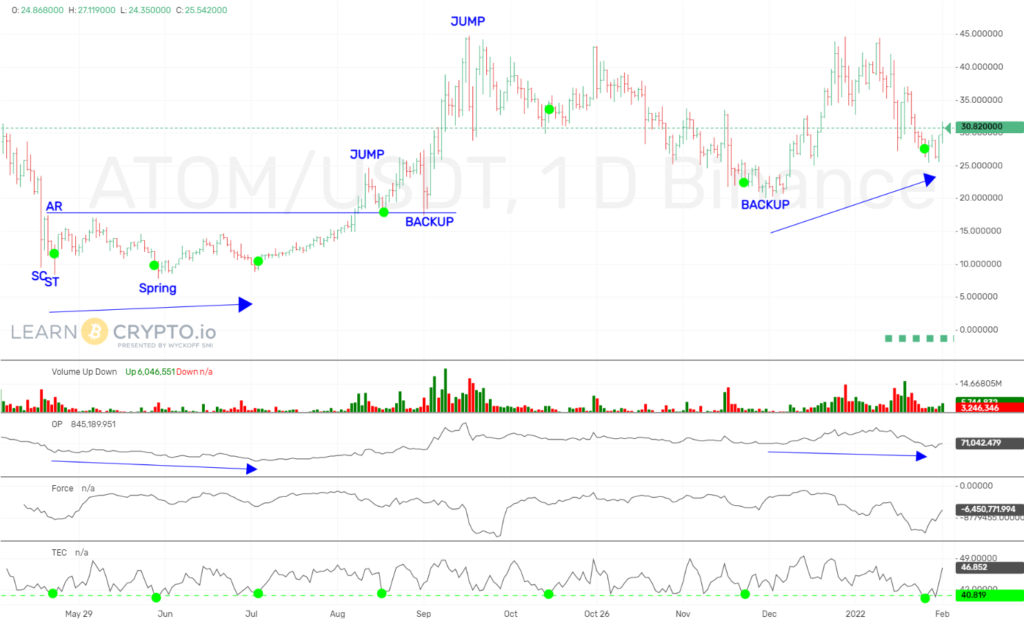
In the Alt Coin area, we want to highlight ATOM. ATOM also just had a bullish divergence as marked with the blue arrows. At the same time it had an oversold Technometer as marked with green circle at bottom. We expect ATOM to be a strong coin on the heels of a Bitcoin rally.
IMPORTANT ANNOUNCEMENT:
We have just released a lower cost version of our Unleashed Course, which is an excellent value at $349.99. Click Here
Our new “Pulse of The Market” charting software for Cryptocurrrencies is now showing consolidated volume from over 140+ exchanges. This is utmost important when applying Wyckoff Technical Analysis. We are showing this software in use on our social media sites, and will be launching for subscription in near future.
We have an active Discord channel where we discuss the Crypto markets. We have had huge success and if you trade Bitcoin you might like monthly access at $40 a month. Join Here
Due to the demand for Bitcoin/Cryptocurrency information and trading knowledge, we released a Cryptocurrency and Wyckoff Trading Course at our site, LearnCrypto.io This course is being offered at an affordable $299.99. We have had 1029 students enroll since its launch on June 22, 2017. On June 28th, 2018 we added lessons detailing the OP, Force, and Technometer and how to use these Wyckoff Tools for analysis.
If you are interested in Wyckoff stock chart analysis as well as Cryptocurrency, search “Learn Crypto / Wyckoff SMI” or click this link https://www.youtube.com/channel/UCDxK2PwEDvoaHZgjPV_WgcA
Please subscribe and click the bell to be notified of our upcoming broadcasts.
If you would also like to follow us on twitter for news and trade ideas, follow “WyckoffonStocks“, “LearnCryptoShow“, or “WyckoffonCrypto“. We have given numerous profitable trades to our subscribers on the Youtube channel, as well as Twitter.
Good Trading,
Todd Butterfield