Strong Correlation Between Bitcoin (BTC) And The Dollar Index Suggests Market Correction Is Over
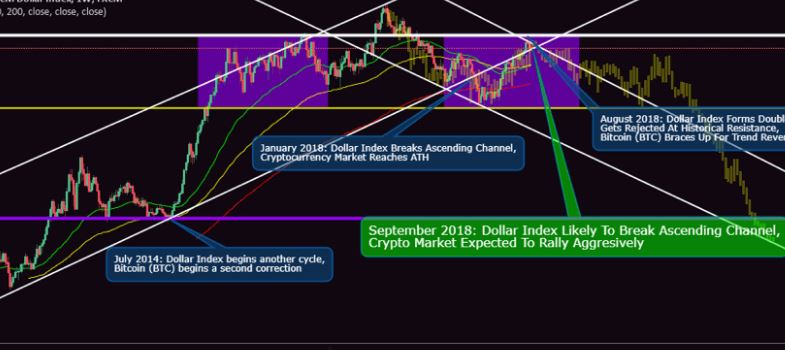
Bitcoin (BTC) has sung to the tune of the US Dollar for as long as we can remember. This is how it goes with the US Dollar and emerging markets. The above chart for dollar index shows how Bitcoin (BTC) has performed at critical stages of the Dow Jones Dollar Index for the past several years. In July 2014, the dollar index began a new rally. As soon as the first candle of that rally formed, Bitcoin (BTC) plunged into a second correction. Bitcoin (BTC) has been trading reactively, not proactively this whole time.
In January 2018 when the dollar index broke below its ascending channel, Bitcoin (BTC) made a new all time high. It is important to note how Bitcoin (BTC) has been waiting for key developments at every point of the cycle in order to react. In August 2018, the dollar index had formed a double top and ran into a historical resistance again and faced rejection. After the rejection, the dollar index has still been trading within the ascending channel. However, the price action has been a mirror image of what it has been before 2017 when the dollar index was rallying instead of falling. Currently, the price is trading within the ascending channel but it is extremely unlikely to break the historical resistance at 12285 unless something unprecedented happens.
Barring extenuating circumstances, the dollar index is very likely to break the ascending channel in September, which will trigger the long awaited trend reversal of the crypto market. If the dollar index follows the same pattern as before, it will be expected to consolidate before a break down. However, if everything happens as expected and the dollar index follows a symmetrical pattern, the year 2022 could really be the year of a global currency crisis and at that time Bitcoin (BTC) could very well reach valuation of a million dollars or higher.

The above monthly chart for BTC/USD shows that Bitcoin (BTC) has just been in a minor correction. Technically, this cannot be called a bear market. The guppy shown on the chart above seems to be constricting same as it did back in 2017 before a major rally. The Volume Price Confirmation Indicator on the lower half of the chart also shows that the price is at the brink of a trend reversal at this point. However, it could still go down till the end of the year in case of a interest rate hike in September which may push the dollar index higher for the time being.

Long term trends are always better indicators of what exactly is going on. Smaller time frame studies and analyses could be misleading or short lived in markets like these. The above weekly chart compares Bitcoin (BTCUSDLongs) Longs against Bitcoin (BTCUSDShorts) Shorts. The chart shows how clearly Bitcoin Longs have been trading in a falling wedge and Bitcoin Shorts have been trading in a rising wedge for more than six months now.
Bitcoin Longs have yet to reach the farther end of the falling wedge which means the bulls might take a while to turn up. However, Bitcoin Longs have reached the limit of their movement in a rising wedge and could break out anytime now. This shows that the bears have lost confidence and at this point are more scared than the bulls, which further corroborates our analysis that this correction is over.


Responses