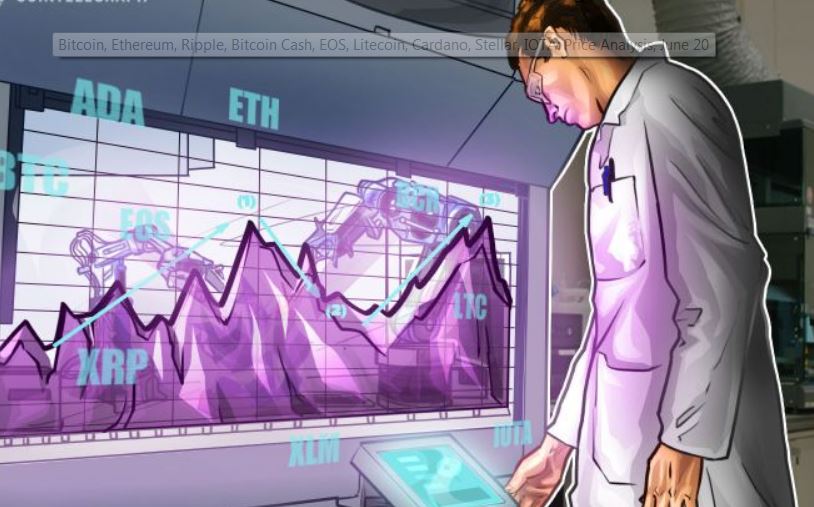
Ripple Price Analysis: Ripple Surges by Over 7% Today As Crypto Markets Attempt Recovery
Key Highlights:
- Ripple sees 7% increase as the rest of the market struggles.
- The cryptocurrency is now in 2nd market position, $2 billion ahead of Ethereum.
- Support moving forward; $0.4975, $0.4755, $0.4702, $0.4535, $0.44, $0.4221, $0.4091, $0.4034, $0.3825.
- Resistance moving forward; $0.5198, $0.5356, $0.5584, $0.5933, $0.6057, $0.62478, $0.6378, $0.6523.
As the rest of the cryptocurrency market struggles to make a recovery, Ripple is leading the pack with a +7.79% increase in price over the past 24 hours of trading. Ripple is presently now trading back above $0.50 at the $0.52 handle, at the time of writing, after seeing a +2.75% price spike over the past 7 trading days.
Ripple is now ranked in 2nd position in total market cap rankings, taking over Ethereum once again. Ripple has continued to grow ahead of Ethereum by a total of $2 billion as it currently holds a total market cap value of $20.79 billion.
XRP has seen a 90 day period where price action has risen by an impressive 61% as the 63-month-old coin now trades at a price that is 85% lower than the all-time high price.
Let us continue to analyze XRP/USD from the medium term and highlight any potential support and resistance zones moving forward.
Ripple Price Analysis [XRP]
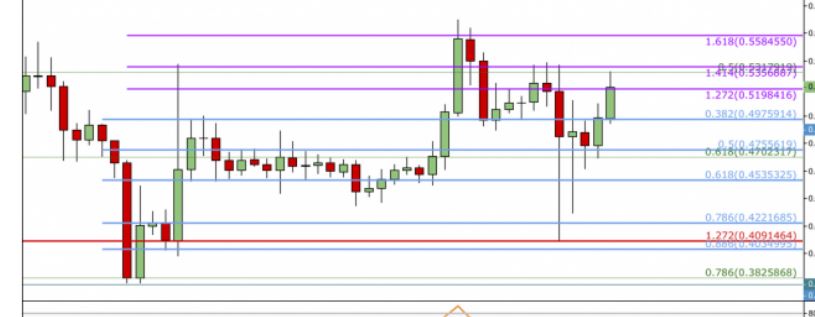
XRP/USD – MEDIUM TERM – DAILY CHART
https://www.tradingview.com/x/hBuQypwg/

Analyzing price action from the medium term we can see that Ripple had seen a small price surge starting from a low of $0.3780 on the 12 of October 2018 and extending to a high of $0.5698 on the 6th of November 2018. This was a price increase totalling 50%.
We can see that on November 14th, the day that Bitcoin plummeted below $6000 in an overall market wipeout, Ripple had dropped to support provided by the downside 1.272 Fibonacci Extension level (drawn in red) priced at $0.4091 before rebounding. The market managed to rebound and find support at the .5 Fibonacci REtracement level (drawn in blue) priced at $0.4755.
The market has since surged and is now trading at resistance provided by the short-term 1.272 Fibonacci Extension level (drawn in purple) priced at $0.5198. Moving forward, if the buyers can push price action above this resistance level and continue higher they will meet resistance at the 1.414 and 1.618 Fibonacci Extension levels (drawn in purple) priced at $0.5356 and $0.5584, respectively.
If the bullish momentum can persist further higher then we can find more resistance above to be located at the medium termed 1.272 and 1.414 Fibonacci Extension levels (drawn in orange) priced at $0.6057 and $0.6248.


Responses