Following Coinbase Pro Launch, EOS Spikes 7% – EOS Price Analysis April 10

EOS has been on a rampage after the cryptocurrency increases by a total of 7% over the past 24 hours, surging EOS to break above the $6.00 level. The coin has now seen a 60% price rise over the past 30 days with a further, rather remarkable, over 120% price increase within the past 90 days.
The recent price increase today can largely be attributed to the fact that EOS has recently been added to Coinbase Pro. In fact, since launching yesterday, Coinbase Pro now accounts for over 35% of the EOS trading volume.
EOS now is ranked in 6th place on the top cryptocurrencies by market-cap value as it holds $5.37 billion market cap.
Looking at the EOS/USD 1-Day Chart:
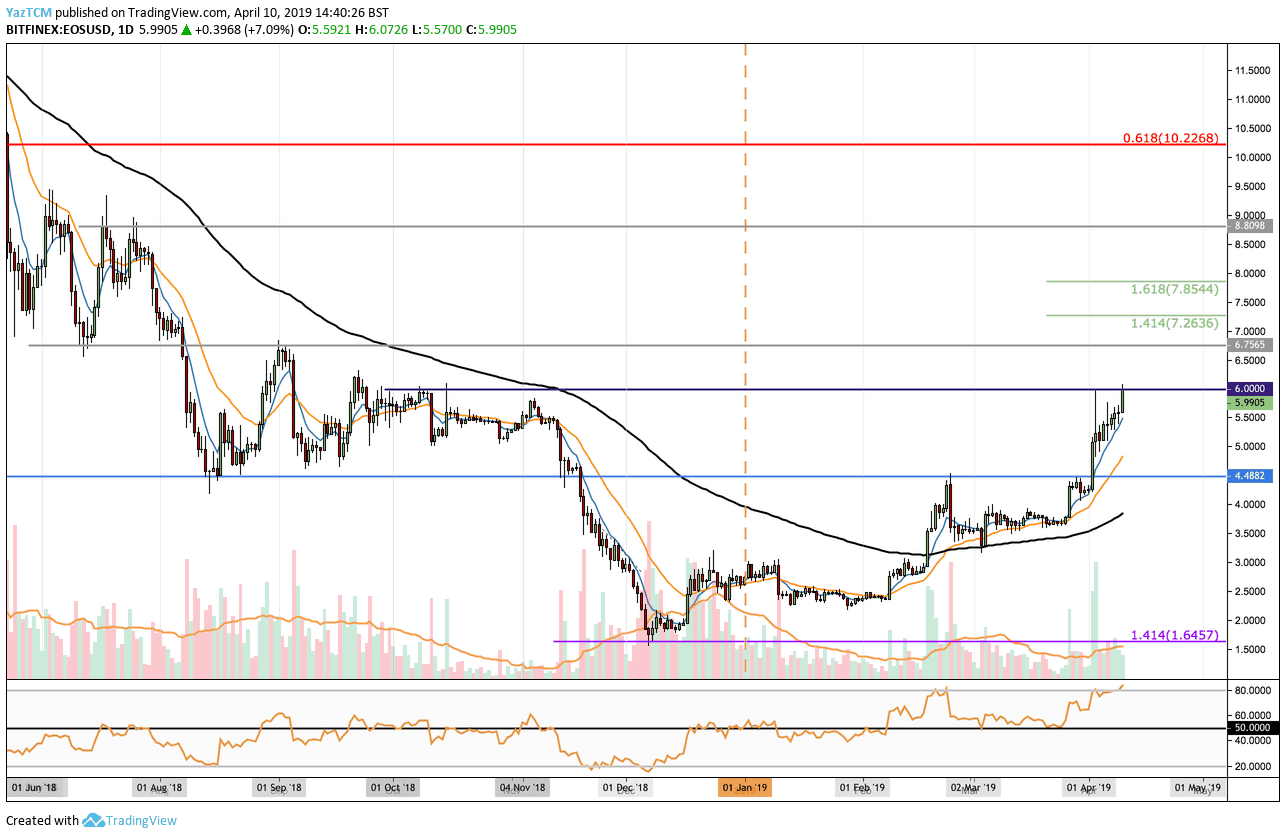
- Analyzing the EOS/USD chart below, we can see that the coin has been on a rising trend since February 2019. The cryptocurrency had broken above the 100-day moving average during February and has continued to climb since then. As April 2019 began, we can see that EOS continued to record fresh 2019 highs above $4.50. The market has recently risen above the EOS November 2018 high after reaching $6.00 earlier today.
- From above: The nearest level of resistance above $6.00 lies at $6.75. Above this, further resistance lies at $7.26 and $7.85, which contains a short-term 1.414 and 1.618 Fibonacci Extension levels. If the bulls break above $8.00, higher resistance then lies at $8.80 and $10.00.
- From below: The nearest level of support now lies at $5.00 and $4.50.
- The trading volume has been increasing significantly during April 2019.
- The RSI has reached overbought conditions, above 80, but continues to look strong. If the RSI starts to turn downward, we can expect a small retracement to occur.
Looking at the EOS/BTC 1-Day Chart:
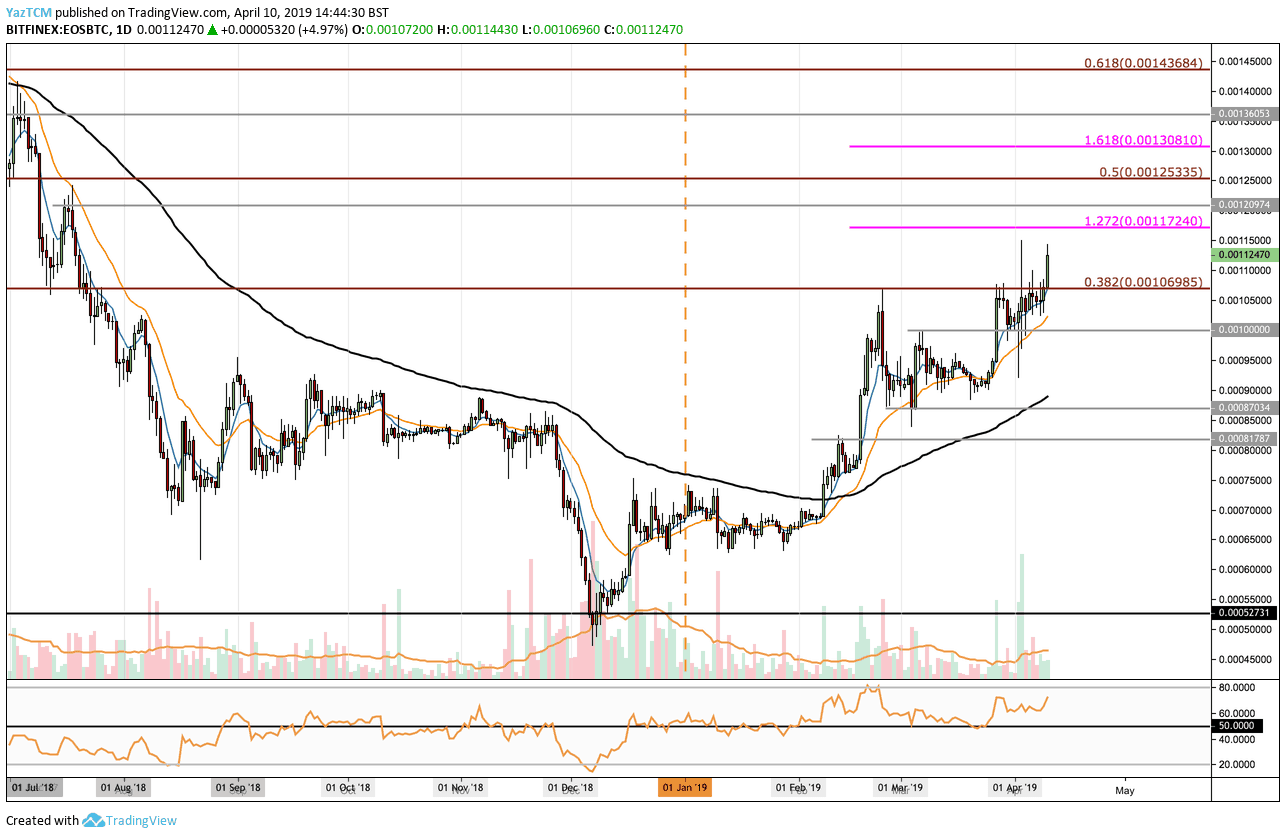
- Against Bitcoin, we can see that the market has recently managed to climb above significant resistance at 0.00106 BTC which contains a bearish .382 Fibonacci Retracement level, measured from the June 2018 high to the December 2018 low.
- From above: The nearest level of resistance now lies at 0.001172 BTC, which contains a short term 1.272 Fibonacci Extension level. This is followed up with resistance at 0.0012 BTC and 0.0013 BTC. Above 0.0013 BTC, further resistance is located at 0.00136 BTC and 0.00143 BTC.
- From below: The nearest level of support lies between 0.00106 and 0.001 BTC. Below this, further support is located at 0.00087 BTC, which also contains the 100-day moving average and 0.00081 BTC.
- The trading volume has also been increasing significantly during April 2019 and remains above average today.
- The RSI is in comfortable bullish territory above 50 and has a lot of room to travel higher before becoming overbought.
Be the first to know about our price analysis, crypto news and trading tips: Follow us on Telegram or subscribe to our weekly newsletter.


Responses