Ethereum, NEO, Monero, Stellar Weekly Price Prediction – Will ETH Break Out Above $165?

The first day of the week found the crypto market in a slump losing roughly $7 billion in just one day. This is quite a big drop but probably a good thing for bullish traders. Most of the losses occurred Monday, March 3rd but since then about $2 billion came back into the market. As expected, most of the top coins are in the red, but since volumes are slowly picking up it is possible, we’ll see the top-ranked tokens resume their new uptrends. The question is when.
Ethereum (ETH) Price Analysis
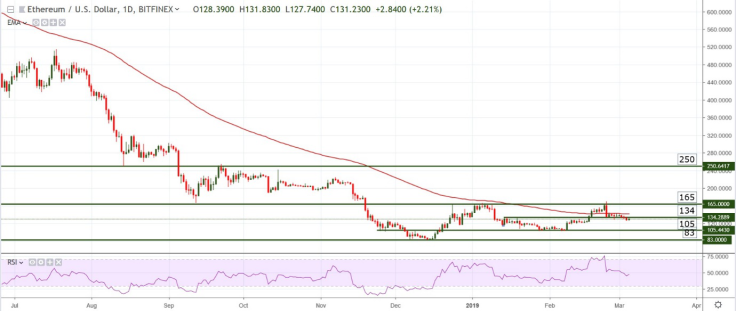
Currently fluctuating between $129 and $130 Ethereum is still holding second place with a market valuation of $13,599,508,394. It is ahead of Ripple’s XRP by almost one billion dollars and looks like it will hold its spot for now. ETH has lost 6.30% over the last 7 days but gained a timid 1.84% in the last 24 hours which shows support is still there. However, the pair seems to lack the necessary bullish pressure to stage a move higher from here, which increases the chance of a drop into the next strong support target at $105. Unless we see a quick turnaround and a move above the 100 days EMA, I expect lower prices in a week’s time.
NEO (NEO) Price Forecast
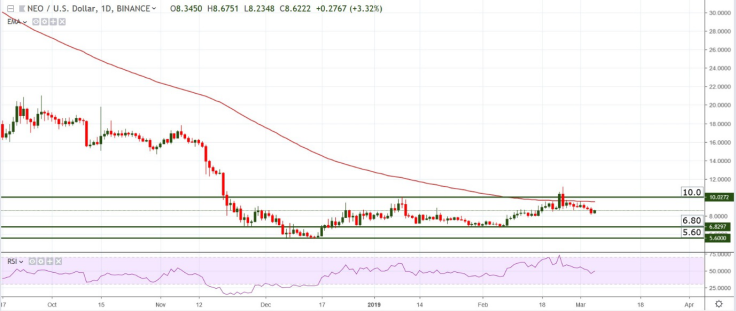
Ranked the 17th cryptocurrency by market cap, NEO is trading at 8.50 against the US Dollar having lost more than 7% over the last 7 days. The recent break of the key handle at $10 seemed like a major victory for the bulls but the move above that resistance proved very short lived. The current bearish move is likely to continue into $7 area or until the Relative Strength Index (RSI) enters/approaches oversold. Candles are small and show lack of conviction from both sides so anything could happen, really.
NEOUSD – NEO Price Chart — TradingView
Monero (XMR) Price Forecast
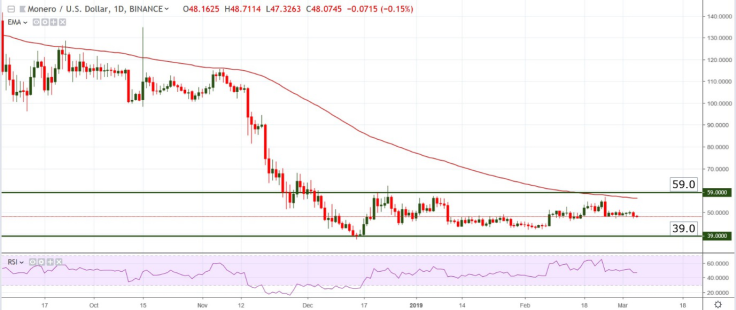
Monero lost only 2.10% over the last 7 days making it one of the more resilient coins in the top 20. It is currently trading just above $48 and ranked number 13 with a market cap of $814,282,121. The pair showed some signs of bullish momentum over the last couple of months but now it has failed three times to break resistance at $59 – $60. This means that we might be gearing up for a stronger drop and an extended period of bearish price action. The first support is located in the $42 – $43 area where support is likely to cause a bounce if not a reversal.
Stellar (XLM) Price Forecast
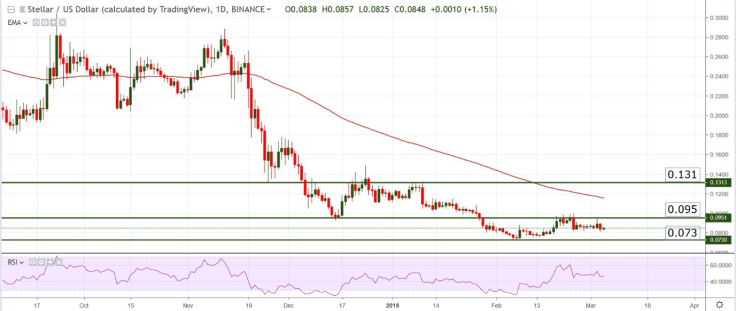
The Stellar Lumens coin is down 1.90% over the last 7 days and had to relinquish its number 8 spot to Binance Coin. At the time of writing XLM is trading at 0.084 against the US Dollar with a market cap of $1,617,844,288. Stellar’s XLM is still in a clear downtrend printing lower lows and lower highs and recently failed, again, to breach resistance at $0.095. There are no bullish signs on the chart whatsoever so unless a news item or a fundamental event pushes this coin upwards, I expect a drop into $0.073 area in a week’s time.


Responses