Bitcoin Price Watch; Here’s What’s On This Morning
It’s Monday morning and it’s time to take a look at action in the bitcoin price over the weekend in an attempt to figure out how we can employ what we’ve seen to try and draw a profit from the market going forward.
As many reading will likely already be aware, things were pretty slow heading into the close of the week last week, with action not really serving up much in terms of opportunities to jump in and out of the markets.
The hope is that, as we move into the session today, things will pick up a bit and – if they do – that we can jump in and out on any volatility for a quick turnaround profit.
Nothing’s guaranteed, of course, especially given the uncertainty surrounding the current regulatory environment, but these sorts of macro factors don’t impact our approach too much.
So, with all that said, let’s get to the detail.
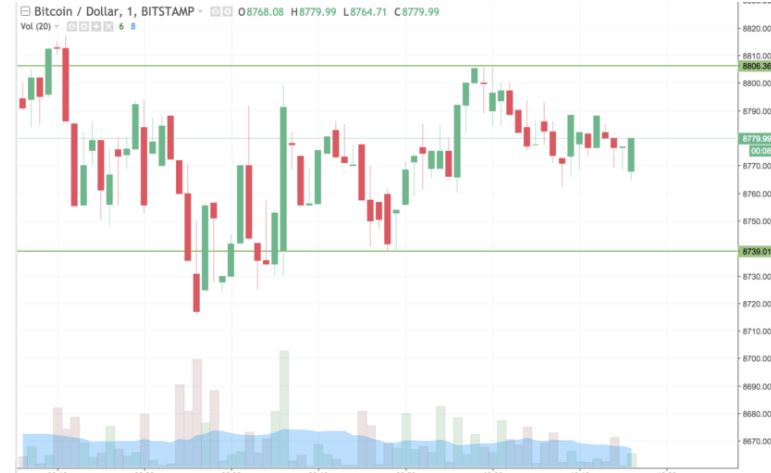
As ever, take a quick look at the chart below before we get started so as to get an idea where things stand. It’s a one-minute candlestick chart and it’s got our primary range overlaid in green.

As the chart shows, then, the range that we are looking at comes in as defined by support to the downside at 8739 and resistance to the upside at 8806.
We’re going to try and get into a long trade if we see price close above resistance. On the position, we’ll target 8950 and we’ll have a stop in place at 8780 to define our downside risk.
Looking the other way, if we get a close below support, we’ll get in short towards a downside target of 8620. A stop on this one at 8755 looks good from a risk management perspective.
Let’s see how things play out and we’ll revisit this evening.
Charts courtesy of Trading View


Responses