Are The Odds Against Bitcoin (BTC)?
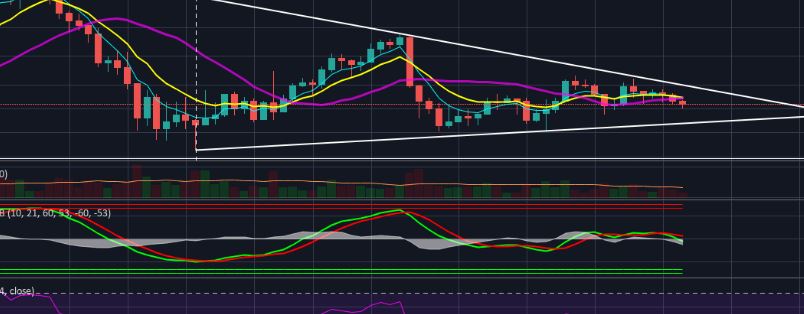
Are the odds against Bitcoin (BTC)? In the short term, yes, the odds are against Bitcoin (BTC). The above daily chart for BTC/USD shows Bitcoin (BTC) trading in a symmetrical triangle. As can be seen very clearly, the price was falling before August 14 when it entered the symmetrical triangle. This means that the price is likely to keep falling after exiting the symmetrical triangle. Technical indicators are also against Bitcoin (BTC). Wave trend analysis points to further downside in the days ahead. RSI also has ample room to go down. The price has fallen below both the 21 Day and 10 Day EMAs. This means that there is not much in the way of Bitcoin (BTC) to fall back to the bottom of the symmetrical triangle.
The symmetrical triangle visible on the BTC/USD daily chart can also be interpreted in a different way. If we consider the period between September and October, we can say that the price was rising (August 14 to September 02) before it entered a bullish pennant. What is the point of this? The point of this is to show you that technical analysis on a shorter time frame could be interpreted in a lot of ways. That is why at times we see some of our chart patterns invalidated and we say, “Technical analysis does not work on crypto”. However, the fact is that we have ignored other possibilities. The shorter the time frame, the more complex the possibilities. Traders need to rely on shorter timeframes to quickly get in and out of positions.

However, for amateur investors who are just looking to accumulate Bitcoin (BTC), short term analyses are not of much consequence as the possibilities and probabilities are far more complex. However, long term trends are always very clear and easy to interpret. The best part about long term trends is that they are harder to manipulate. An analysis made on a 15 min timeframe has a higher chance of being proven wrong compared to the one made on a monthly timeframe. Even though blockchain might soon change this, but the world today is still highly dependent on big data. Big corporations like Google or Amazon use data to analyze trends. Financial institutions, for instance banks use data to determine the likelihood of a loan being paid back.
In our world, big data is of big significance. Long term trends, whether it is for a commodity like Gold or a currency pair like EUR/USD seldom changes. The same is true of Bitcoin (BTC). The above monthly chart for BTC/USD shows that Bitcoin (BTC) has managed to stay above the 21 Month EMA since 2016. This is a big deal. That is why the price has managed to stay above this level, despite testing it continuously for the last four months. Bitcoin (BTC) has started this month by staying above the 21 Month EMA. This is a long term trend that is not easy to manipulate. For Bitcoin (BTC) to close a monthly candle below the 21 Month EMA, a major sentiment shift has to occur. As long as it stays above this level, the odds are not against Bitcoin (BTC).


Responses