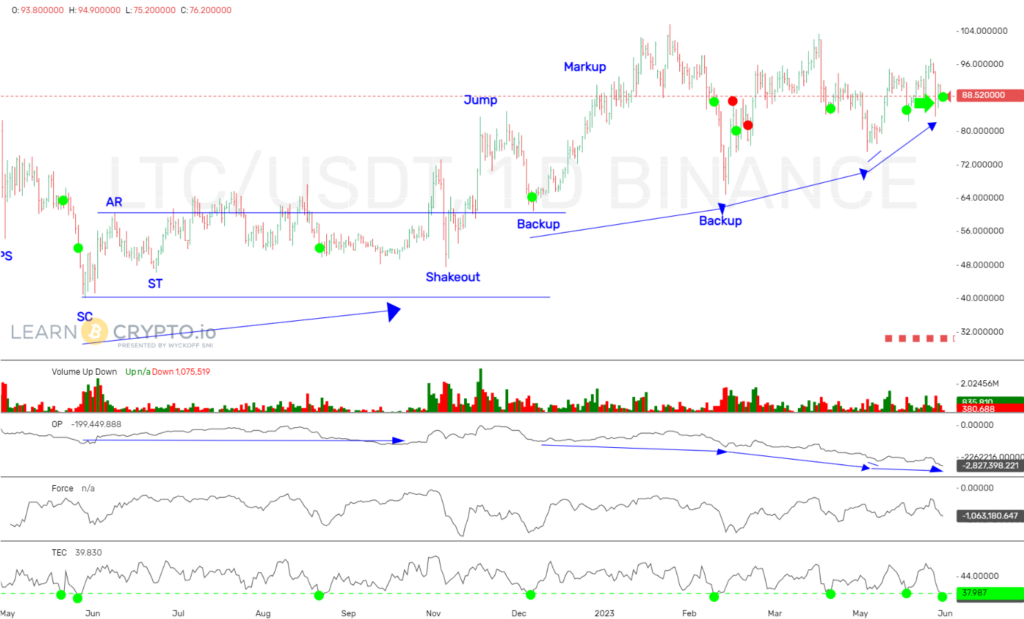
Wanted to post my Wyckoff chart showing OP continuing to hit new lows while price moves sideways in a possible triangle. And the Technometer is once again oversold….

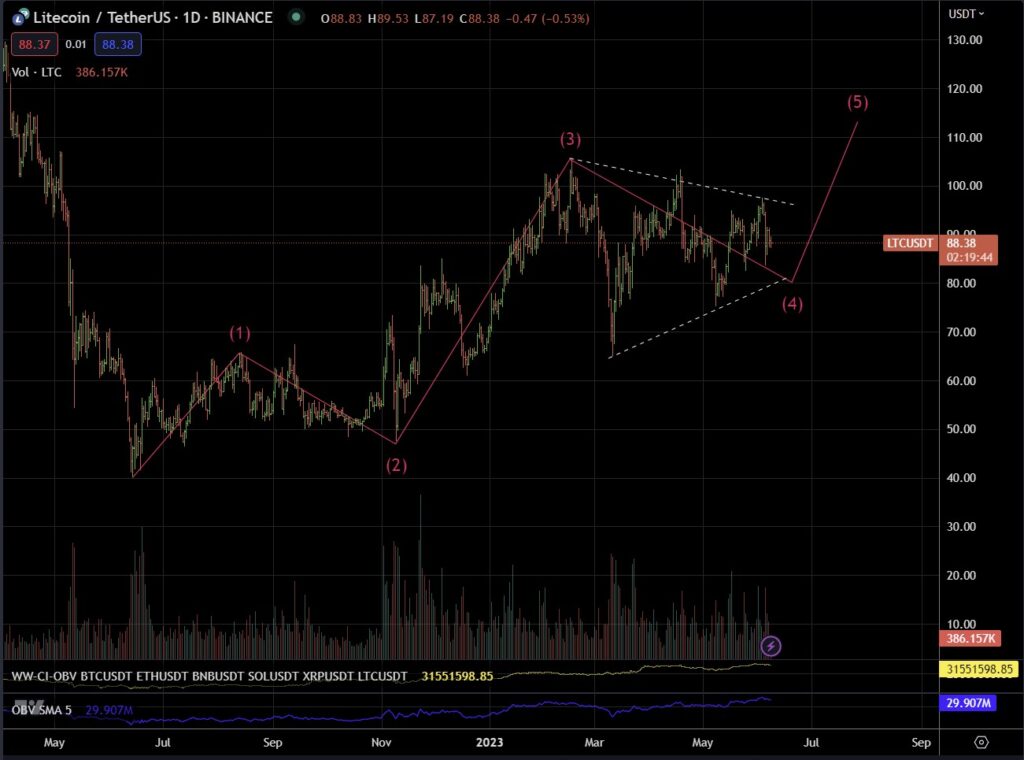
Here is Elliott Wave Intl’s count for LTC. They are looking for one more break to $80 to complete the red wave 4 triangle.