Why Shorting Bitcoin (BTC) At These Levels Is A Recipe For Disaster
Bitcoin (BTC) appears to be at the risk of a fall to $3,000 or lower levels. Until recently, the probability of a fall to at least $3,000 seemed likely considering that the price was overbought short term. It appeared as neither the bulls nor the bears were convinced that this was the bottom and the price had to fall lower in order to take a decisive stance. However, soon as Bitcoin (BTC) fell to the 200 Week MA in the last 24 hours, we saw a strong pullback to the upside which has once again tilted the balance in favor of the bulls. This sentiment shift has more to do with the price action on EUR/USD than Bitcoin (BTC) itself.
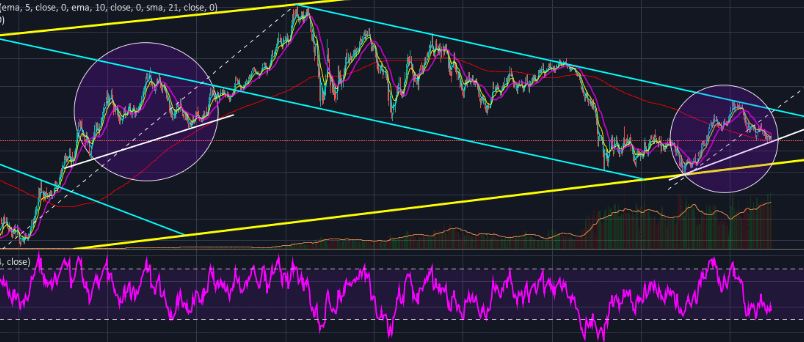
Throughout Bitcoin (BTC)’s trading history, we have seen that whenever EUR/USD rises, Bitcoin (BTC) rises and whenever it falls, Bitcoin (BTC) falls. In other words, Bitcoin (BTC)’s price reacts directly to the movement of EUR/USD. This is only reasonable to expect considering Bitcoin (BTC) is paired to the US Dollar (USD) on most markets. For the past few months, we have seen Bitcoin (BTC) fall sharply towards the end of the week. However, we have reasons to believe that this trend is about to change. If we look at the weekly chart for EUR/USD, we can see that the EURO is following the exact same pattern that it followed between 2004 and 2006. We have referred to this similarity many a time in our previous analyses and it is no surprise that this pattern has followed through down to the letter.
he two encircled fractals resemble each other at every stage. Considering that EUR/USD has followed this fractal for the last two years, it is only reasonable to assume that is going to keep on being followed. By that logic, we can expect EUR/USD to begin its climb from next week onwards it has now found support on a historical trend line. As EUR/USD rises, we should see Bitcoin (BTC) react directly and rise in price as well. This is why shorting Bitcoin (BTC) at this point to expect something out of the ordinary is a very risky play. The EUR/USD weekly chart is not the only one to give us clues as what is about to follow next. Bitcoin (BTC)’s own charts indicate that this decline has run its course and we are about to see a major correction to the upside in the weeks ahead.
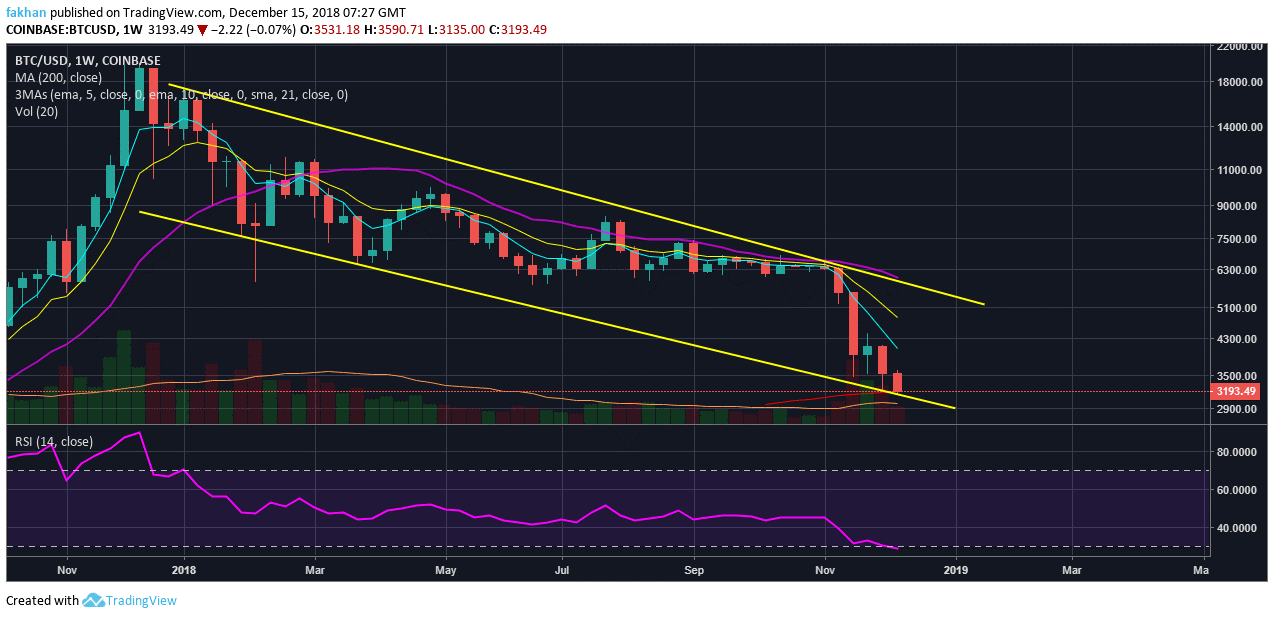
The weekly chart for BTC/USD shows that Bitcoin (BTC) has reached the bottom of its descending channel and is now expected to rise towards the top of the channel. We have reasons to believe that this downtrend is going to be broken during Bitcoin (BTC)’s upcoming rise towards the top of the channel. However, even if that is discounted, we can still expect a major rally from current levels that should see the price climb past $5,000. RSI for BTC/USD is also in the oversold territory and has long been eyeing a reversal from current levels. If we look at this downtrend channel for BTC/USD, we can see that since the correction, Bitcoin (BTC) has only tested the top of the channel once, and that was just last month. The price has now touched the bottom of this channel for the fourth time and is expected to rally from here.
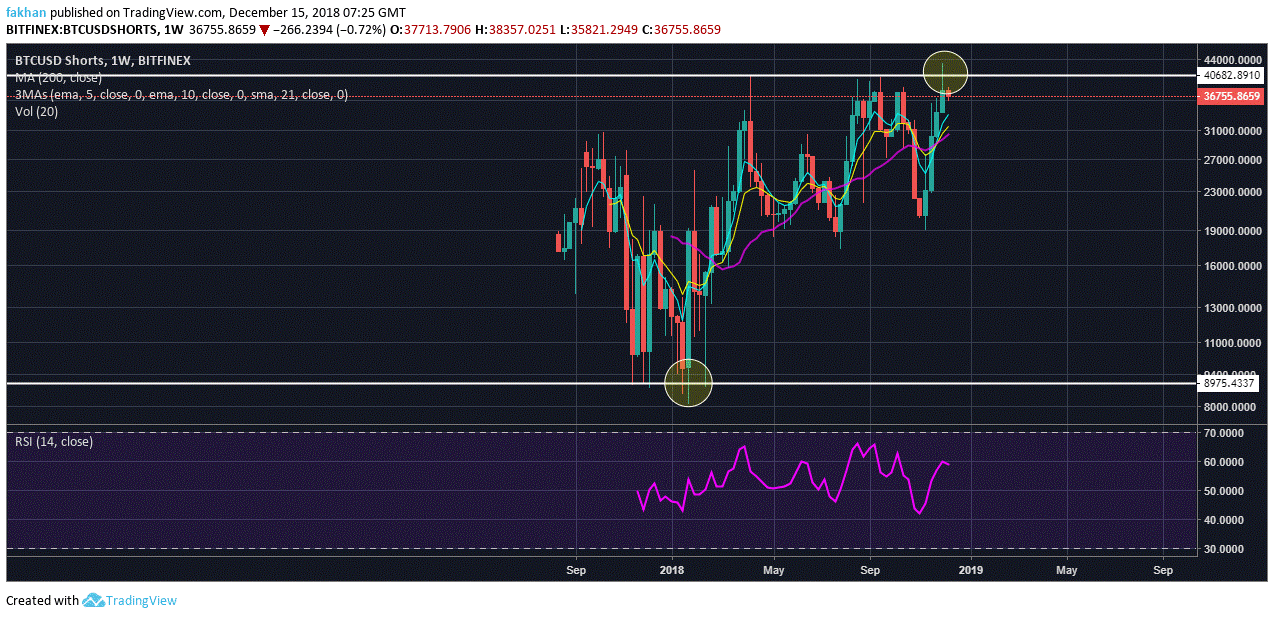
Bitcoin (BTC)’s own price action is quite significant in itself but it helps to see what the bulls and bears are actually thinking. The number of shorts has just peaked after reaching a new all time high. Now, it is time for a correction and as we can see on the weekly chart for BTCUSDShorts, the decline has already started. We believe that the number of shorts is going to decline aggressively over the next few weeks that is going to result in a big spike in the price of Bitcoin (BTC). That being said, BTCUSDShorts should not be expected to reach towards the bottom in one go. We expect that it will form a head and shoulders before an inevitable decline around mid 2019.


Responses