The Crypto Bubble Isn’t A Bubble, It’s A…

I’ve written over 300 crypto related posts since I saw the crypto light on June 29th, 2017. After three months, on October 8th, 2017, I published my first thought piece “7 Thoughts On Blockchain, Cryptocurrency & Decentralization After Three Months Down The Rabbit Hole”. It’s still the most read/clapped post I’ve written. The 5th thought was “ It’s A Bubble….So What”. I went on to explain:
I say “so what” because I believe in Amara’s Law: We tend to overestimate the effect of a technology in the short run and underestimate the effect in the long run. This is part of the reason we get bubbles. We get overexcited about a new technology and we drive up prices beyond any reasonable valuation. Bubbles can go on for years. The internet bubble lasted 5+ years.
With that thought piece recently celebrating it’s 4 year anniversary, it still feels like we’re having a Cambrian Explosion in crypto. Just as the Cambrian period enabled the creation of a multitude of new life forms, the emergence of blockchain, cryptocurrency, and decentralization, is enabling new, better, fairer ways to do everything. And just as most of the life forms that emerged from the Cambrian explosion quickly died out, most emerging crypto companies will fade away, but many of the ones that survived … will be EPIC!
As we sit here today, making ATH on bitcoin (up 4.5X the last year) ETH (up 10X), and many many other coins, the bubble question is becoming a major topic of conversation. I think the three charts below give additional perspective to crypto bubble debate:
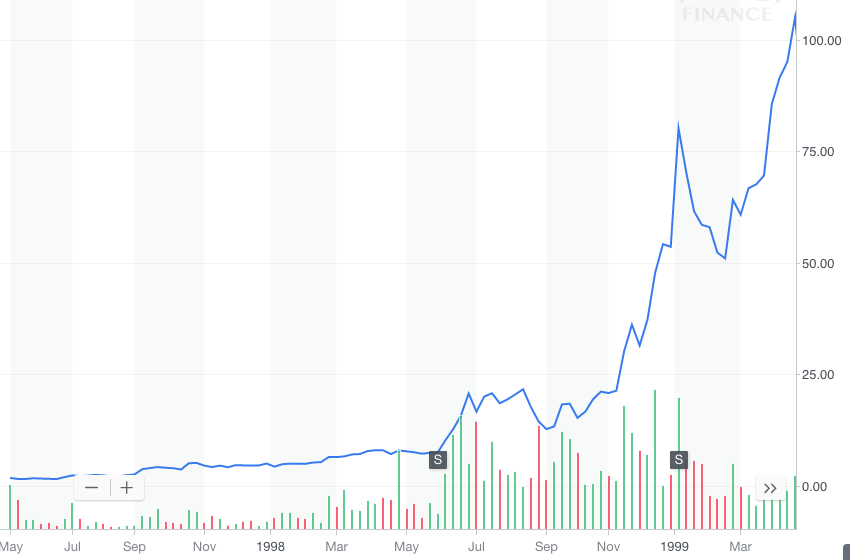
1. Amazon Price Chart 1997–1999
The chart below looks at the meteoric (70X!) rise of Amazon’s price from it’s IPO in May, 1997 (at a split adjusted $1.50 a share) to a peak of $105+ in April, 1999. Was that a bubble?

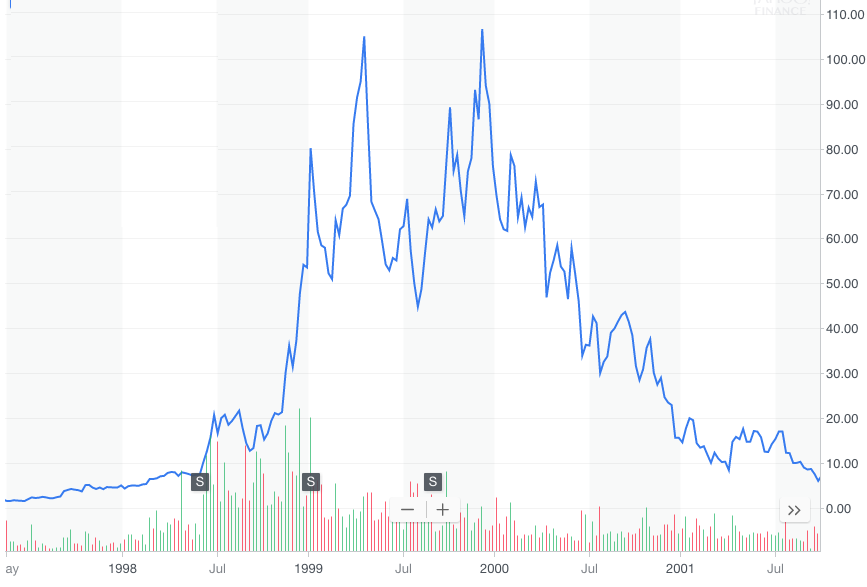
2. Amazon Price Chart 1997–2001
The chart below takes the chart above, and extends it out two more years, as Amazon shares plunged to a low of less than $6 in September, 2001. That’s a drop of 95%. Does the chart below tell the story of a bubble, and then a bubble bursting?

3. Amazon Share Price 1997–2021
Since Amazon’s share bottomed out in September 2001, it is up more than 615X. From its IPO price of $1.50, it’s up 2325X, generating a compounded annual return of 38% for 24 years.
With the perspective of more time, when we look at Amazon’s price chart from 1997–2021, that violent up ‘97-’99 (bubble?), and violent implosion down ‘99-’01 (a bubble crashing?), we see it really wasn’t either of those.

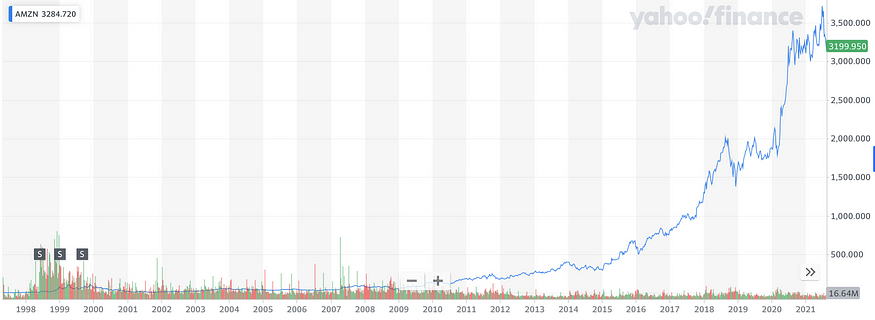
It turns out Amazon’s share price from 1997–2001, when put in to the context of time, and what Amazon became, was just a ……. blip.
In 10 years, when crypto has disrupted as many industries as the internet has, and bitcoin is at or above $1M, we’ll look back at the previous violent crypto price swings, and the violent crypto price swings certain to come, and they’ll simply be blips in crypto’s long term rise. They’ll be blips in crypto’s massive value creation. And most importantly, they’ll be blips on the path to the better (decentralized) planet we’ll be living on.
By: Lou Kerner
This content is for educational purposes only. It does not constitute trading advice. Past performance does not indicate future results. Do not invest more than you can afford to lose. The author of this article may hold assets mentioned in the piece.
If you found this content engaging, and have an interest in commissioning content of your own, check out Quantum Economics’ Analysis on Demand service.


Responses