Samsung Plan Massive for Ethereum (ETH) Even as Prices Crumble

Ethereum Price Analysis
Fundamentals
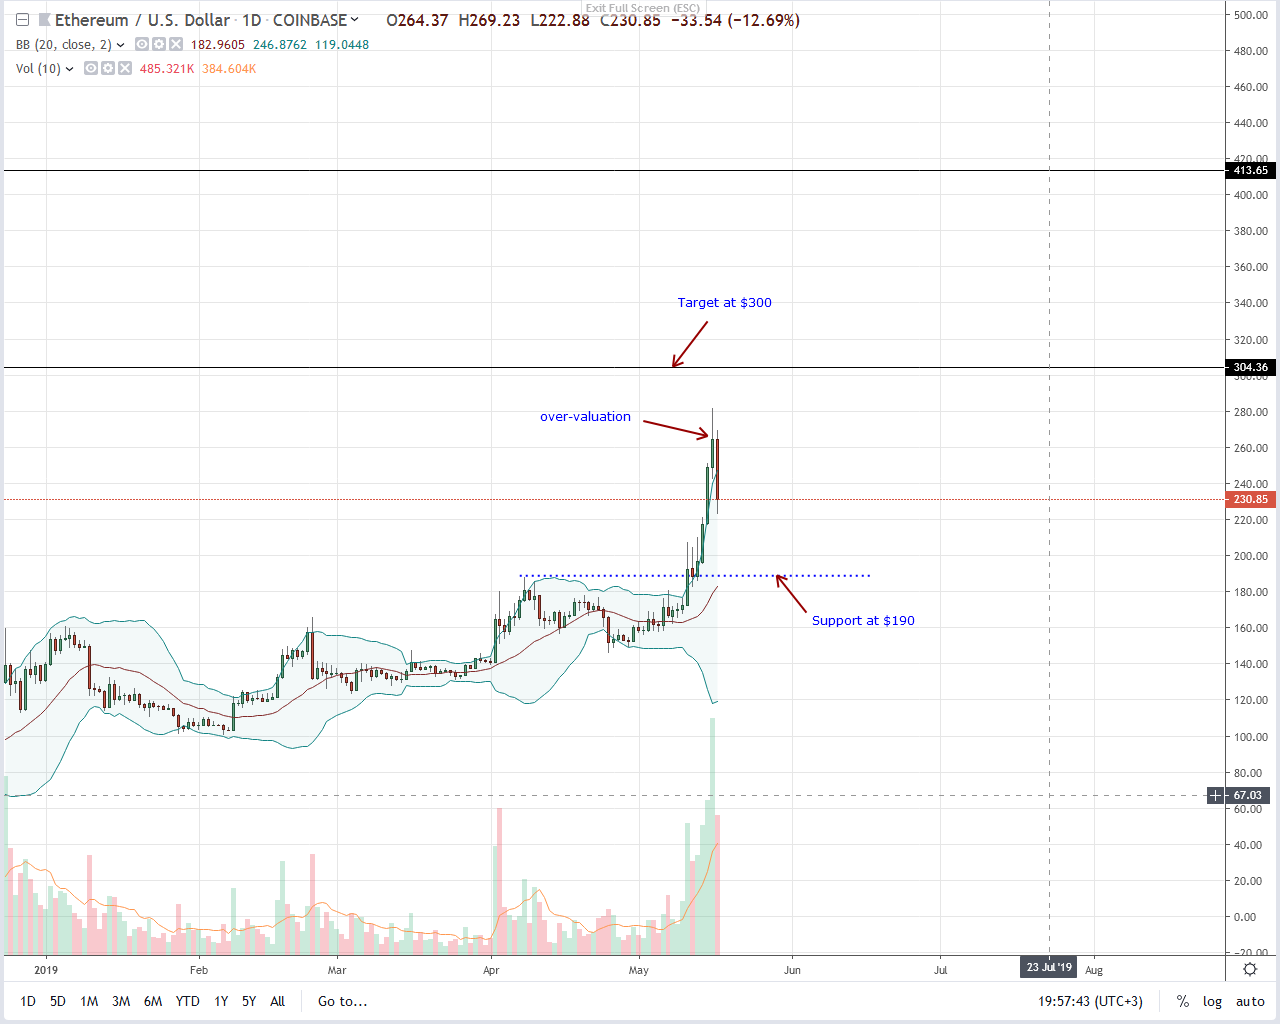
Like all liquid assets, Ethereum (ETH) is nose diving. At the time of press, the second most valuable asset is down, falling 11.7 percent to $235. But, after days of impressive gains, surging 55 percent mid this week, a cool off was inevitable. There were hints from price action and today’s slide is therefore not a surprise but a confirmation. As a result, aggressive traders can take this opportunity to ramp up in lower time frames once buy signals print. It’s easy to see why.
Fundamentals are positive. Fresh reports indicate that Samsung may introduce cryptocurrency and blockchain functionality in their budget Galaxy phones. The inclusion of crypto wallets in these low-cost smartphones is a massive boost for Ethereum and other ERC-20 projects supported by Samsung’s Blockchain KeyStore.
Meanwhile, Fred Wilson, a partner at Union Square Ventures, has confirmed that 60 percent of CoinBase’s trading volumes come from institutions. He goes on to say that only a handful of token and crypto funds are “all-in” and it will take time before traditional institutions become active:
“When people read in the Wall Street Journal that institutions are coming to crypto, they think Goldman is coming, but in reality, maybe 100 token funds in the US and 100 in Asia are all in so far.”
Candlestick Arrangement

From price action, Ethereum (ETH) is down 11.7 percent, but the trend is up, and buyers are in control. Already, what we have in the daily chart is a classic double-bar bear reversal pattern. All that is needed is confirmation. Considering today’s sharp losses, sellers may step up tomorrow.
However, the fall is natural because of Ethereum (ETH) overvaluation. Before today, five consecutive bars closed above the upper BB, pointing to an over-extension and a likely fall as participants search for equilibrium.
Because of that, odds are, ETH prices will slide to $190 in a retest before buyers flow back, propelling prices above $275 towards $300, $400 and later $450.
Technical Indicator
Our reference bar is May-16. It has a high participation level—822k against 356k. Therefore, in a correction, any bear bar must record lower volumes below 822k for our effort versus result analysis bull trend to be valid.
Chart courtesy of Trading View. Feature Image Courtesy of Shutterstock.


Responses