Quiz Summary
0 of 8 Questions completed
Questions:
Information
You have already completed the quiz before. Hence you can not start it again.
Quiz is loading…
You must sign in or sign up to start the quiz.
You must first complete the following:
Results
Results
0 of 8 Questions answered correctly
Your time:
Time has elapsed
You have reached 0 of 0 point(s), (0)
Earned Point(s): 0 of 0, (0)
0 Essay(s) Pending (Possible Point(s): 0)
| Average score |
|
| Your score |
|
Categories
- Not categorized 0%
- 1
- 2
- 3
- 4
- 5
- 6
- 7
- 8
- Current
- Review
- Answered
- Correct
- Incorrect
-
Question 1 of 8
1. Question
The Wyckoff Wave measures price, the OP Index measures volume, and the Force Index is an indicator of investor sentiment.
CorrectIncorrect -
Question 2 of 8
2. Question
If price is moving in one direction, and the direction and pressure from the Force Index is in another, the move could be substantial.
CorrectIncorrect -
Question 3 of 8
3. Question
An extremely negative Force Index reading is an indication that the reaction will be strong and it will be sustained.
CorrectIncorrect -
Question 4 of 8
4. Question
The Force Index should be used alone, and not in conjunction with the Technometer.
CorrectIncorrect -
Question 5 of 8
5. Question

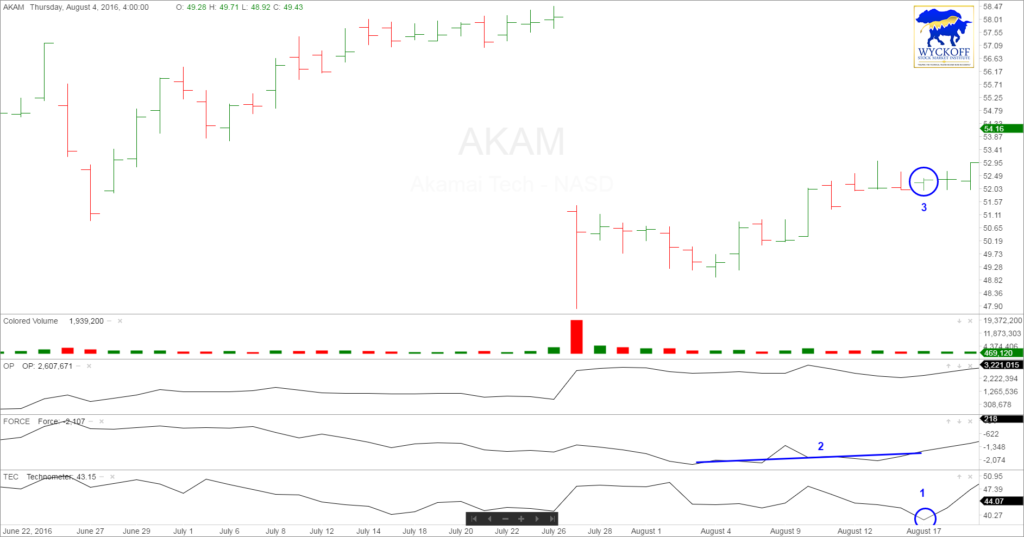
If the Force index has been trending higher as marked by point 2, and the Technometer becomes oversold, what would be the most appropriate action to take at point 3.
CorrectIncorrect -
Question 6 of 8
6. Question

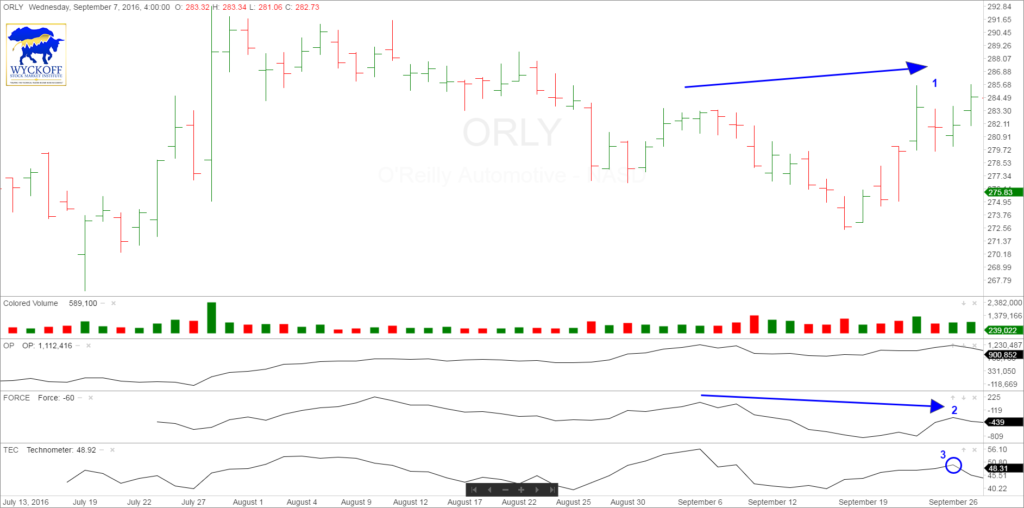
The stock of O’Reilly Automotive rallies to point 1 and has hit a new high as compared to the previous rally top. The Force Index made a lower rally top at point 2, as the Technometer registered an overbought reading. These indications are all bearish but the expected reaction will be.
CorrectIncorrect -
Question 7 of 8
7. Question

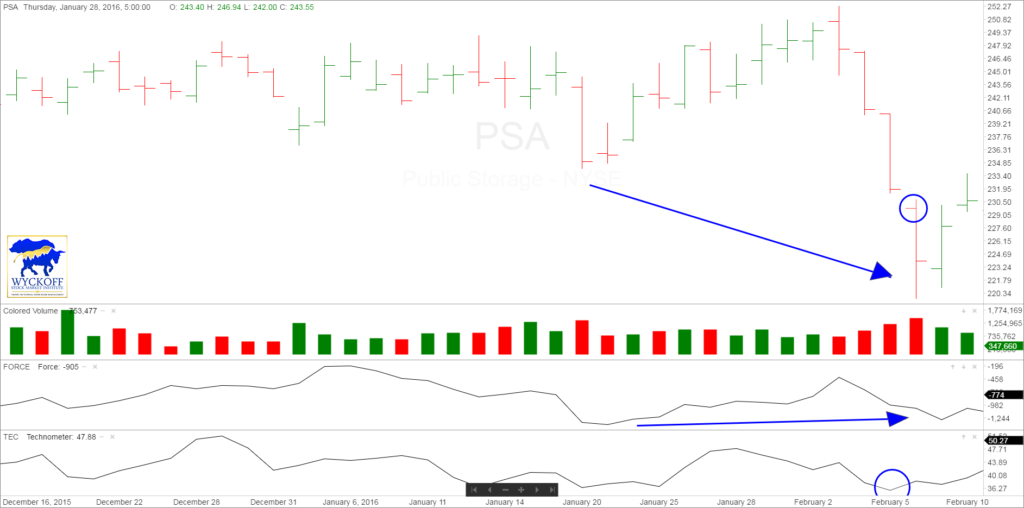
The stock of Public Storage has broken thru the previous lows on the chart, but the Force index is holding the lows. At the same time the Technometer registers an oversold reading. We these conditions you would expect the rally to be.
CorrectIncorrect -
Question 8 of 8
8. Question

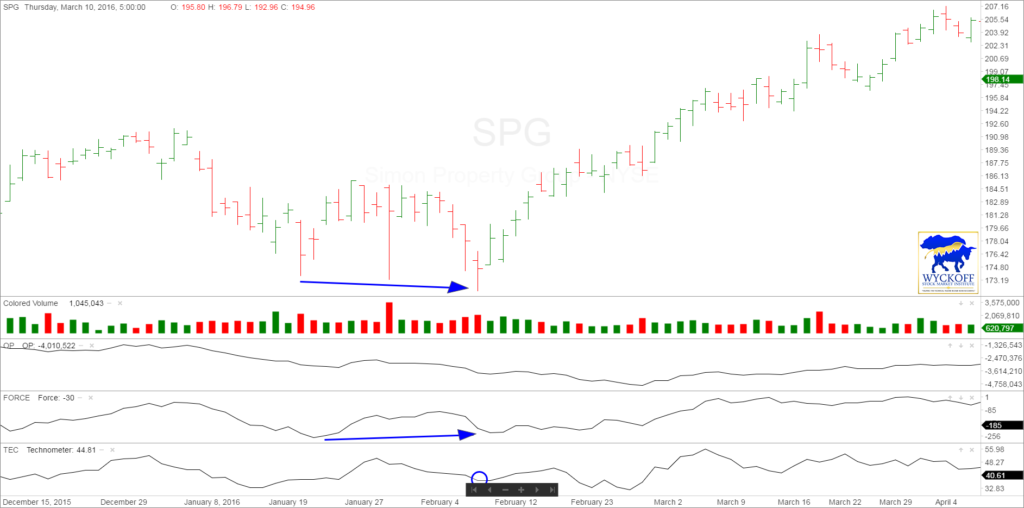
This chart of Simon Property Group where marked in blue shows.
CorrectIncorrect

