BlackRock Bitcoin ETF sees first outflow day amid record ETF bleed
BlackRock’s ETF saw around $37 million in outflows for the first time, while the remaining spot Bitcoin ETFs collectively notched over $526.8 million in outflows.…

BlackRock’s ETF saw around $37 million in outflows for the first time, while the remaining spot Bitcoin ETFs collectively notched over $526.8 million in outflows.…
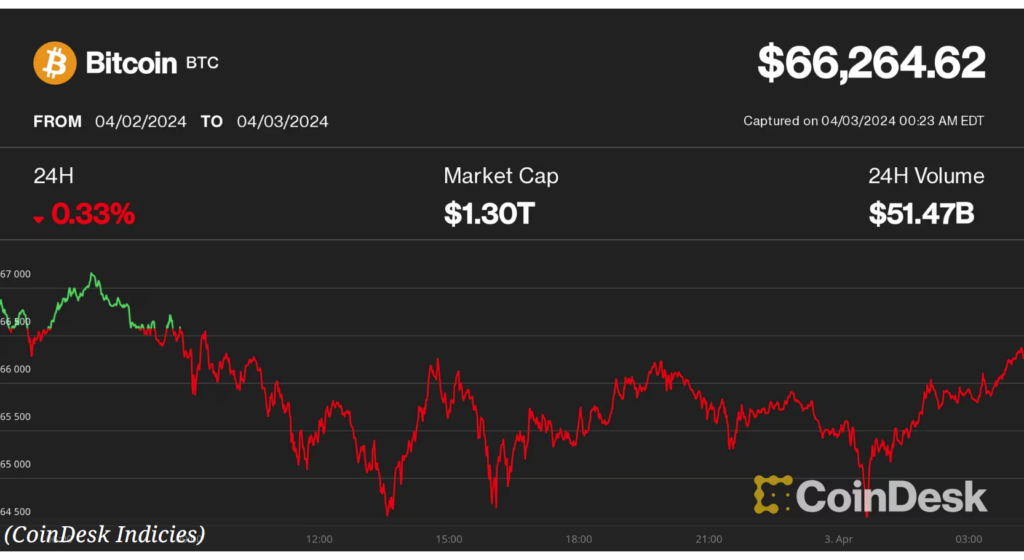
Prediction markets and CME’s Fed Watch Tool have virtually ruled out a rate cut until later this year Bitcoin (BTC) held on to losses during the Asian…
Grayscale’s GBTC product saw large outflows last week and inflows to other ETFs did not increase in tandem, briefly fueling concerns of a spot-driven selloff.…
The largest cryptocurrency is now just 5% away from its 2021 high in U.S. dollar terms, having already reached records in other currencies. Bitcoin (BTC) crossed the…

In a bold move, ARK Invest CEO Cathie Wood has reaffirmed her bet on Bitcoin, predicting that the cryptocurrency’s price could surge to $1.5 million…

With the expected launch of a spot bitcoin ETFs in Q1 of 2024, broader crypto is coming of age, says CoinDesk Indices head of research,…

Bullish bets by institutional investors and knowledgeable market participants have reached an all-time high on the CME, data tracked by MacroMicro show. Smart money, or…

Data shows over $1 billion worth of BTC has been withdrawn from exchanges over the past week. The case for a continued rally in bitcoin (BTC) to $40,000 and…

The spread between dominant crypto options exchange Deribit’s forward-looking 30-day implied volatility index for ether (ETH DVOL) and bitcoin (BTC DVOL) has been consistently negative…

Mainstream interest in the crypto market remains low as key economic indicators show continued decline in the disposable income of the U.S. households. “2023 is…
Please confirm you want to block this member.
You will no longer be able to:
Please note: This action will also remove this member from your connections and send a report to the site admin. Please allow a few minutes for this process to complete.