Bitcoin Price Forecast – Is A Strong Price Increase Around The Corner?

In our Bitcoin Price Forecast on the 4th of September, at a Bitcoin price of $10,247, we wrote the following:
„Bitcoin reached our correction target of $10,000, and failed to find sustainable support at the 0.382 Fib level at $10,900 $! Whether or not Bitcoin’s correction continues depends on if it will be rejected at the resistance levels of $10,771 and $11,280. Should this be the case, a death cross in the 4H chart would follow. Then, Bitcoin could fall back to $9,600 or $8,600 respectively. Right now, Bitcoin might correct upward (Until $11,280). As long as the $10,000 level holds, the Bitcoin trend would be relatively bullish!”
Bitcoin Price Forecast – Is the trend still bullish?
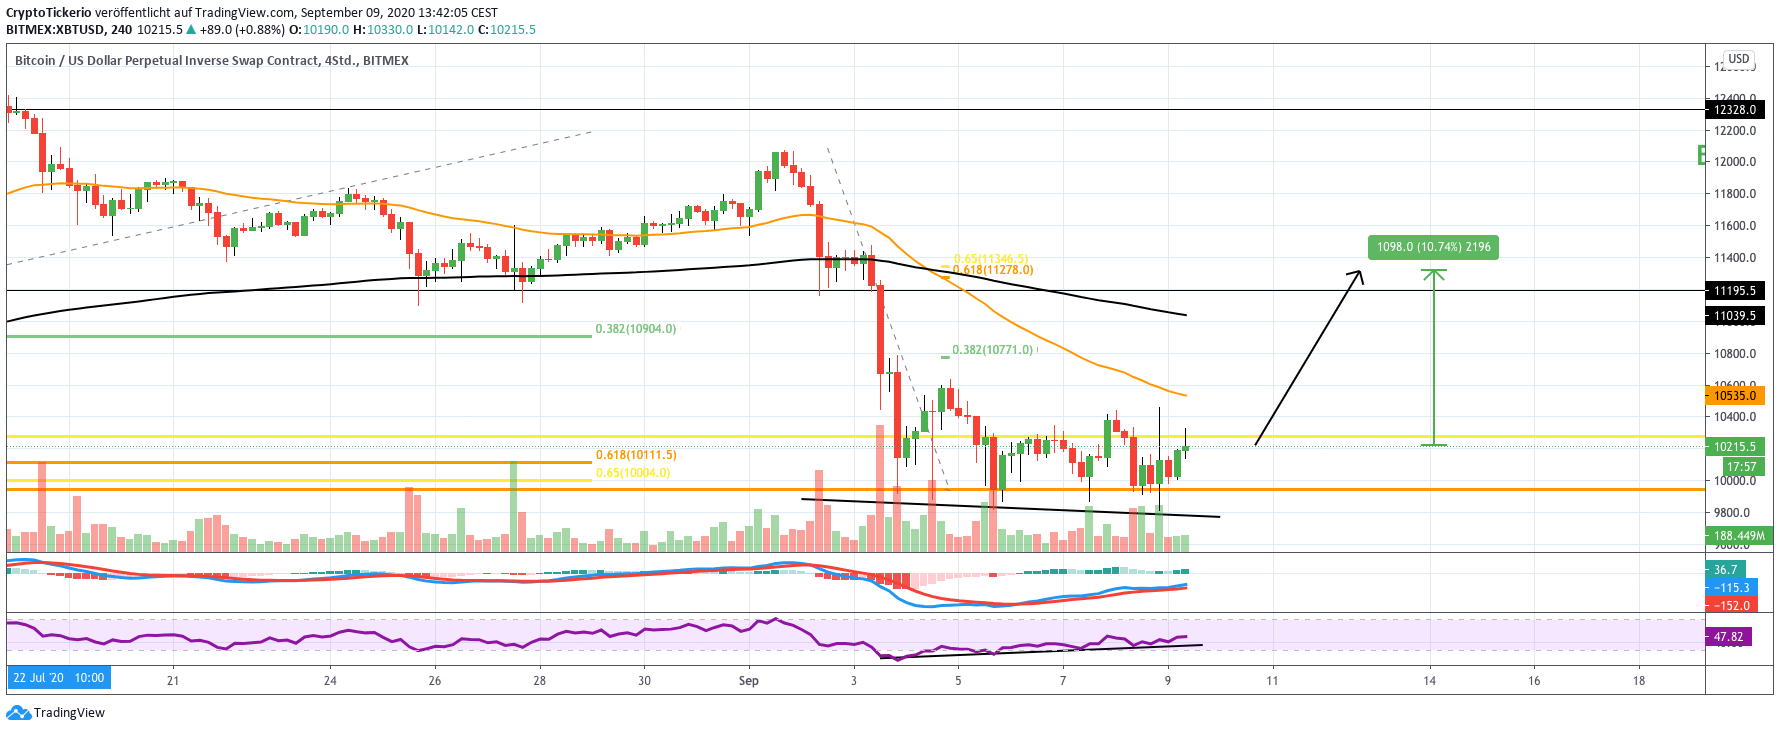
Even though it came to a death cross in the 4H chart, confirming the trend to be bearish in the middle-term, a bullish divergence has manifested in the RSI, following which the Bitcoin price might now rise to the golden ratio at ±$11,200! This implies an upward potential of around 11%. Should the Bitcoin price not only reach this level, but break it as well, it would be possible for Bitcoin to rise all the way to it recent high of $12,500!
Currently, the $10,000 mark is successfully holding as support. This golden ratio support is a key resistance level. Because in case it fails as a support, Bitcoin’s price could fall down all the way to the horizontal support at $8,600!
Bitcoin Price Forecast -The daily chart looks good as well!
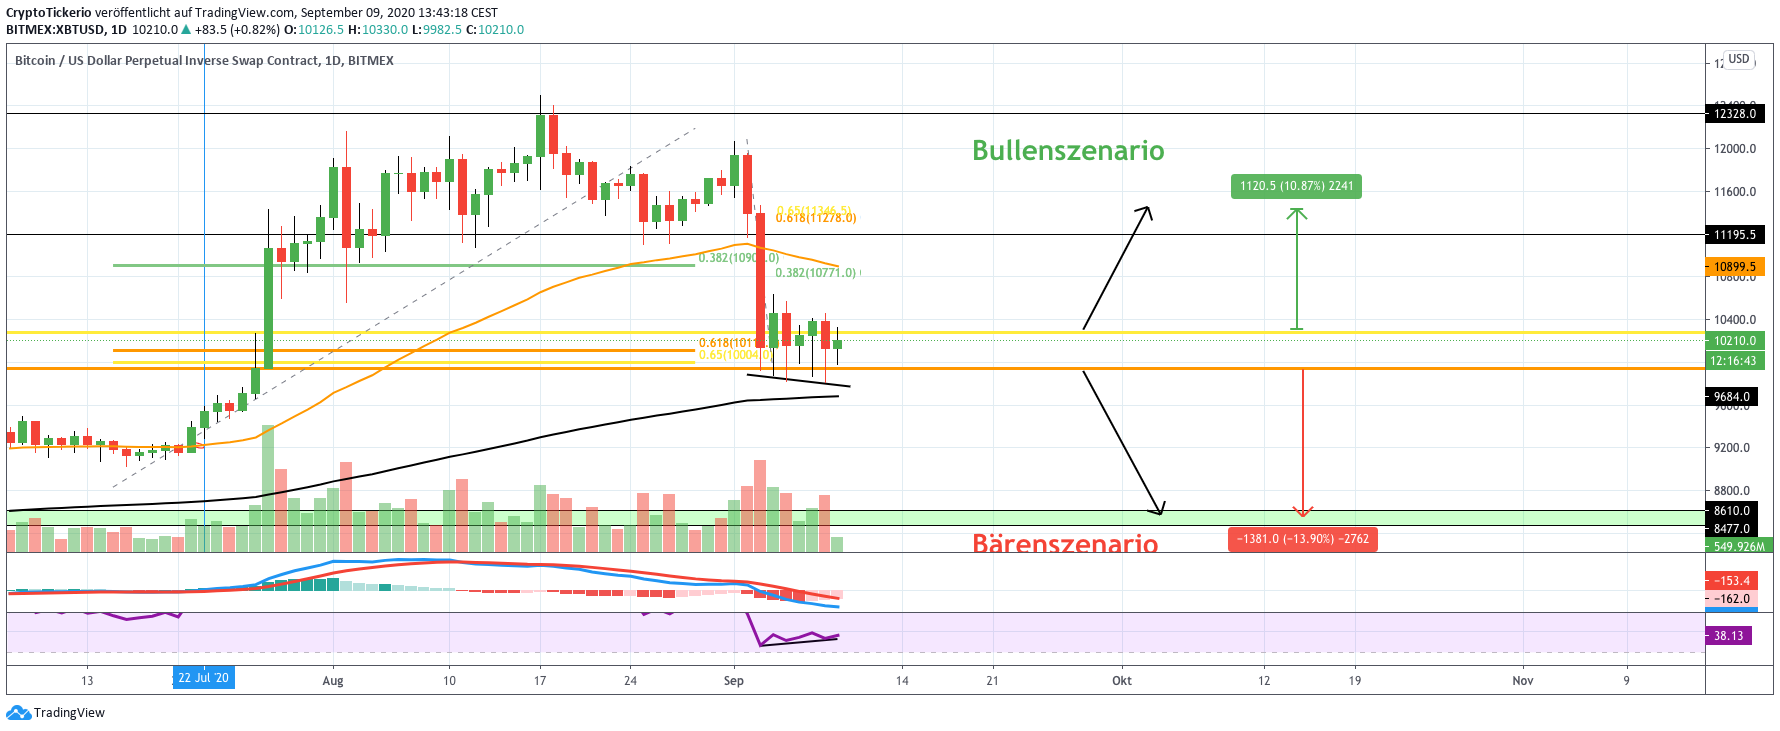
In the daily chart, a bullish divergence is forming for the RSI as well. The MACD histogram has been developing bullishly again for the last three days, and it could come to an upward move. Should Bitcoin bearishly break the $10,000, it would imply a downward drop up to 14% before the next support is met.
Bitcoin Price Forecast – Will the weekly candle close above $10,000?
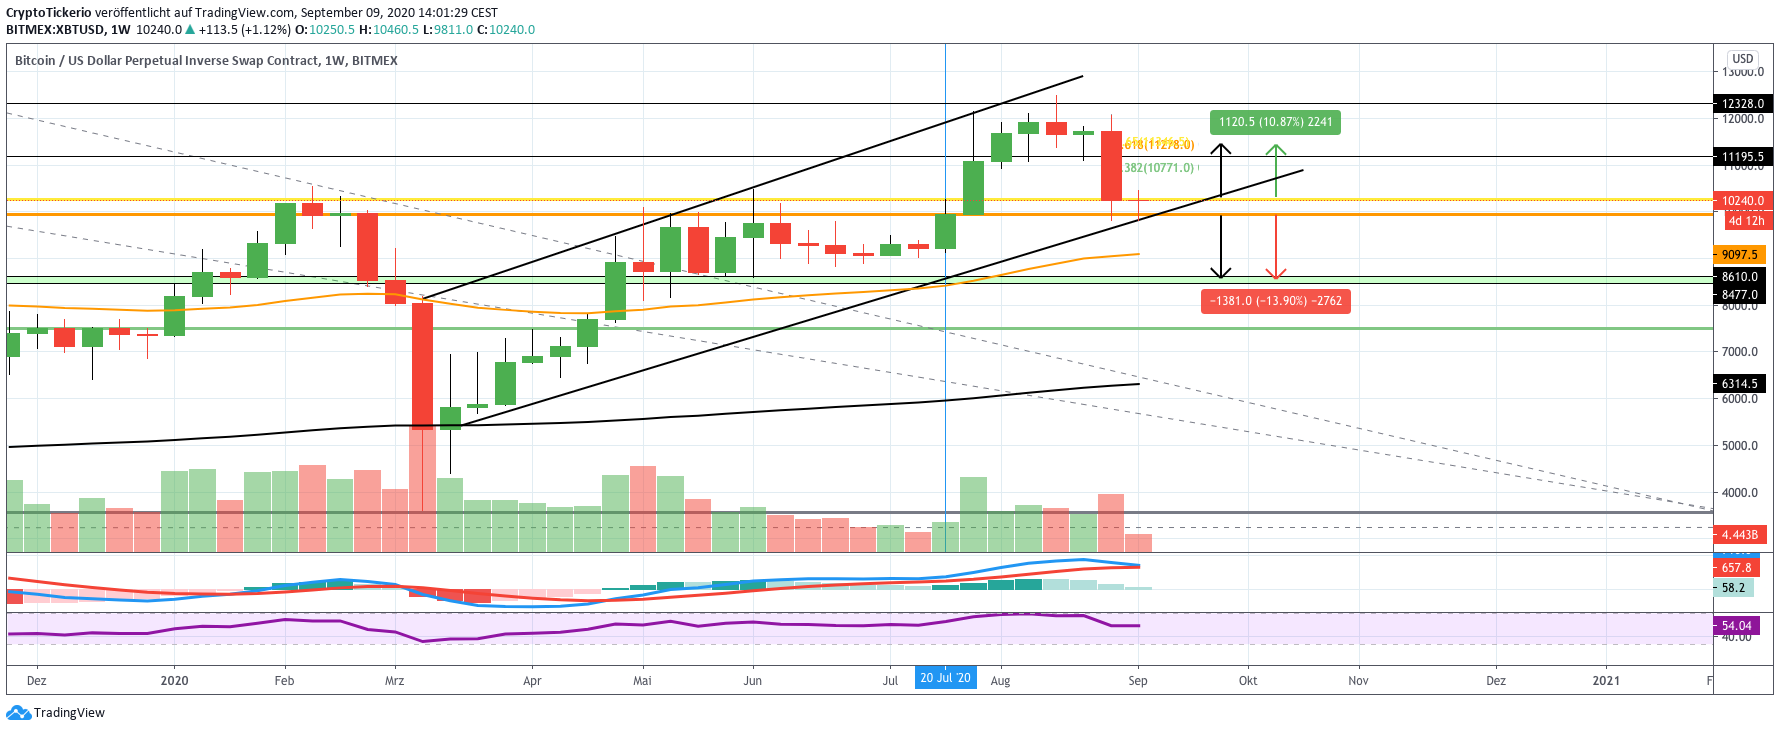
Since we are still in the middle of the week, it remains to be seen if Bitcoin can close the week above $10,000. Should Bitcoin close above $10,250, the weekly candl would even be green. A red candle below $10,000 would call for possible price drops. Optimally, Bitcoin would close above $10,700, which would mean the weekly candle closed above the 0.382 Fib level.
Should the weekly candle however close below $10,000, we should prepare ourselves for $8,600. Although it is possible for Bitcoin to find support at $9,655 at the 200-Daily-EMA, but a weekly close under $10,000 would be bearish. Therefore the Bitcoin price should close the week above $10,000 to remain bullish.
However, the weekly MACD is signaling a continuation of the correction. Should Bitcoin fall to $8,600, it is important that it strongly rebounds from this level, otherwise the bull rally might’ve hit its end.
This article is written by Konstantin


Responses