Bitcoin Eyes Price Breakout Amid US-Iran Tensions

Bitcoin is drawing bids amid heightened geopolitical uncertainty and could soon rise above key resistance at $7,580, confirming a short-term bullish breakout.
The top cryptocurrency is currently trading at $7,530, representing a 1 percent gain on a 24-hour basis, according to CoinDesk’s Bitcoin Price Index. Prices are now up nearly 10 percent from lows near $6,850 registered during the Asian trading hours on Friday.
Notably, the cryptocurrency picked up a bid at lows near $6,850 after the U.S. launched an airstrike at Baghdad’s international airport, killing top Iranian General Qassem Soleimani.
Tensions escalated over the weekend, with Iran’s supreme leader Ayatollah Ali Khamenei promising revenge and President Trump warning Tehran against retaliatory actions.
Through all this, bitcoin remained bid and hit a two-week high of $7,580 earlier Monday.
Hence, many in the investor community think the U.S.-Iran tensions are powering gains in bitcoin. After all, the cryptocurrency is considered as digital gold by the likes of Michael Novogratz, the founder of the cryptocurrency asset management firm Galaxy Digital. Novogratz tweeted on Sunday:

Backing Novogratz’s view is popular trader Holger Zchaepitz, who expects bitcoin and gold to continue rising on the back of tensions in the Middle East.
While Novogratz and Zchaepitz consider bitcoin a safe haven, trader Ran NeuNer believes the cryptocurrency is still an uncorrelated asset and could be the best hedge against risk intensification.

With the safe-haven narrative strengthening, bitcoin looks set to scale resistance at $7,580.
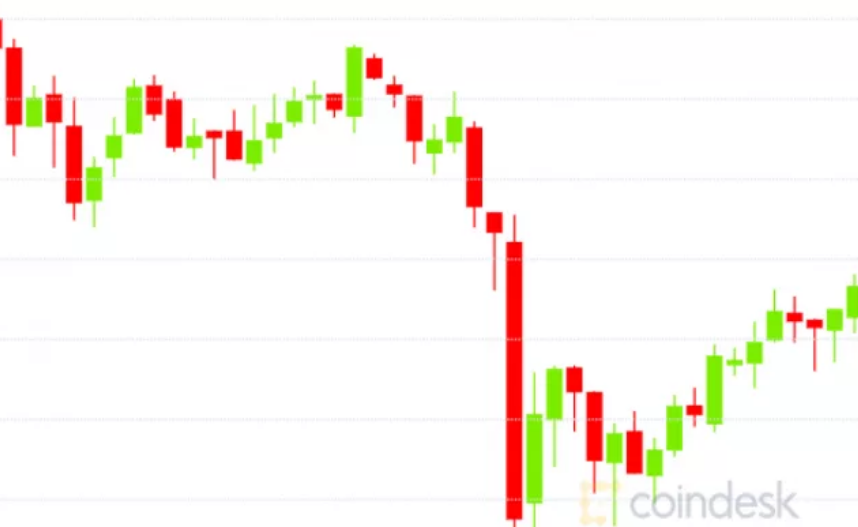
Daily chart

Bitcoin is forming an inverse head-and-shoulders breakout on the daily chart (Bitstamp prices). A UTC close above $7,580 would confirm the breakout (a short-term bearish-to-bullish trend change) and open the doors for $8,735 (target as per the measured move method).
The breakout looks likely, with the 14-day relative strength index hovering at a two-month high of 56.00. A reading above 50 indicates bullish conditions.
Weekly chart

The long-tails attached to the hammer candle created in the seven days to Dec. 22 and the last week’s doji candle indicate seller exhaustion and support the case for a breakout on the daily chart.
Even so, the bulls are cautioned against being too ambitious, as prominent analysts like @BitBitCrypto and Peter Schiff think the cryptocurrency has rallied since Friday due to speculators buying on the hope that bitcoin will attract haven demand from traditional investors.
So, an inverse head-and-shoulders breakout could end up trapping bulls on the wrong side of the market or may remain elusive if that flow dries up.
A failure to hold above today’s low of $7,342 would validate the bearish view put forward by the descending 10-week moving average and likely yield a re-test of $6,850.
Disclosure: The author does not currently hold any digital assets.


Responses