Ethereum (ETH) All Set To Begin Another Uptrend Amid Fears Of Further Sell-Off
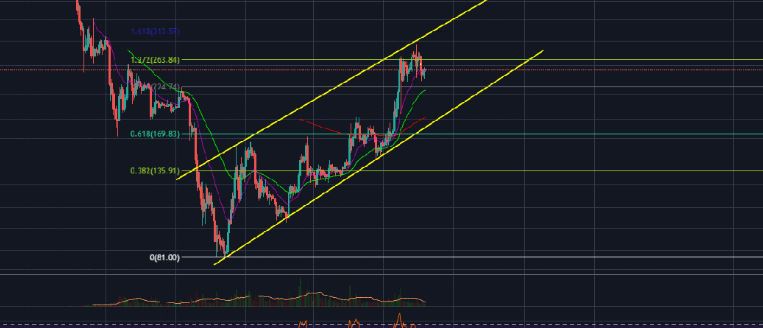
Ethereum (ETH) ran into the top of an ascending channel and it retraced sharply. After that it attempted to test the top of this channel yet again and declined even sharply. We still think that ETH/USD has room to test the top of this channel once again. This would most likely be a test of the 1.618 fib retracement level. If the price faces a rejection at the top of the channel for the third time, we are likely to see it decline more aggressively towards the bottom of this channel. This ascending channel also forms part of a large bear flag which indicates that it might eventually be broken and the price could decline to double digits as early as this year.
The golden crosses that most are anticipating on cryptocurrencies like Ripple (XRP) have already resulted in price boosts on Bitcoin (BTC) and Ethereum (ETH). As Bitcoin (BTC) and Ethereum (ETH) dictate most of the market movements, it is reasonable to assume that those golden cross formations might end up being bull traps that will lure in unsuspecting bulls before a big fall. The daily chart for ETH/USD shows that there is plenty of room for a rally now that the RSI has cooled off. However, that still does not change the fact that the price remains heavily overbought on the weekly time frame. Sooner or later, we are going to see Ethereum (ETH) begin its next downtrend and that is when the altcoin market will experience maximum pain. Greedy retail bulls who are trading Bitcoin (BTC) for altcoins like Ethereum (ETH) will soon find out that just because things are bad, does not mean they cannot get worse.
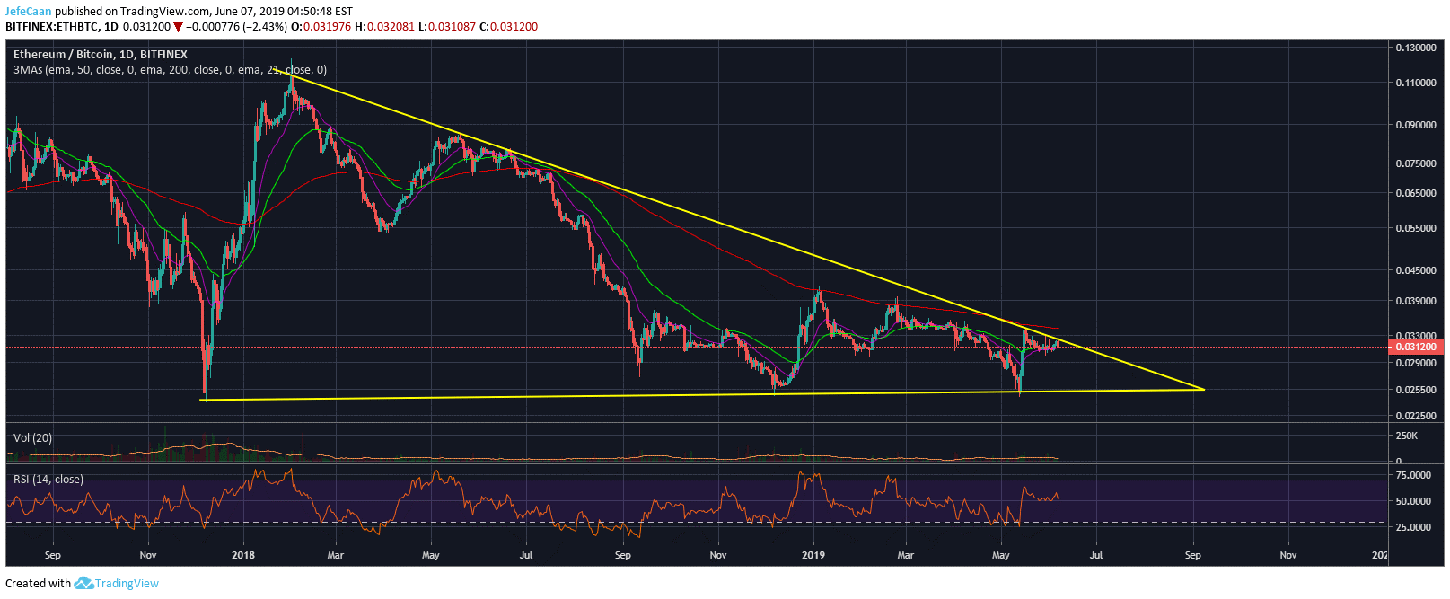
Ethereum (ETH) has yet to break out of a long descending triangle against Bitcoin (BTC). RSI on the daily time frame is now close to overbought territory but it is not overbought just yet. The price has however faced a strong rejection at the long term trend line resistance but that does not mean that we cannot see a fake out short term. In fact, the most likely scenario would be for the price to stage a fake out around the same time as BTC/USD tops out. It is likely to leave a long wick to the upside as ETH/BTC closes inside the triangle.
The near term outlook of Ethereum (ETH) indicates that it will have to rally at nearly the same pace as Bitcoin (BTC) or slightly lower for the next few days and weeks. This would make holding Bitcoin (BTC) a better deal than Ethereum (ETH) if you intend to remain in cryptocurrencies instead of fiat. The daily chart for ETH/BTC also shows that the price has faced strong rejections several times at the trend line resistance of the descending triangle. If the price falls to the bottom of this triangle again, it is likely to break below it, pushing ETH/BTC towards new lows in the weeks and months ahead.


Responses