Quiz Summary
0 of 51 Questions completed
Questions:
Information
You have already completed the quiz before. Hence you can not start it again.
Quiz is loading…
You must sign in or sign up to start the quiz.
You must first complete the following:
Results
Results
0 of 51 Questions answered correctly
Your time:
Time has elapsed
You have reached 0 of 0 point(s), (0)
Earned Point(s): 0 of 0, (0)
0 Essay(s) Pending (Possible Point(s): 0)
| Average score |
|
| Your score |
|
Categories
- Not categorized 0%
- 1
- 2
- 3
- 4
- 5
- 6
- 7
- 8
- 9
- 10
- 11
- 12
- 13
- 14
- 15
- 16
- 17
- 18
- 19
- 20
- 21
- 22
- 23
- 24
- 25
- 26
- 27
- 28
- 29
- 30
- 31
- 32
- 33
- 34
- 35
- 36
- 37
- 38
- 39
- 40
- 41
- 42
- 43
- 44
- 45
- 46
- 47
- 48
- 49
- 50
- 51
- Current
- Review
- Answered
- Correct
- Incorrect
-
Question 1 of 51
1. Question
The first step of the Wyckoff Method is to determine the trend of the stock market, and then to trade with that trend.
CorrectIncorrect -
Question 2 of 51
2. Question
You then want to buy those stocks that are weaker than the general market, and sell those stronger.
CorrectIncorrect -
Question 3 of 51
3. Question
Using the Buying/Sellings tests can help you find a promising stock to trade.
CorrectIncorrect -
Question 4 of 51
4. Question
When supply is greater than demand prices rise.
CorrectIncorrect -
Question 5 of 51
5. Question
The trend is your friend
CorrectIncorrect -
Question 6 of 51
6. Question
The important factors in the stock market are
CorrectIncorrect -
Question 7 of 51
7. Question
A stock chart tells you all you need to know about that stock.
CorrectIncorrect -
Question 8 of 51
8. Question
Large volume at the top of a rally phase usually indicates strong buying.
CorrectIncorrect -
Question 9 of 51
9. Question
When a stock has a correction of less than 50% of the previous rally this is considered bullish
CorrectIncorrect -
Question 10 of 51
10. Question
A trading range is NEVER signs of accumulation
CorrectIncorrect -
Question 11 of 51
11. Question
A spring is a drive down through previous support, to get the general public to sell their stock right before the advance is prepared to begin.
CorrectIncorrect -
Question 12 of 51
12. Question
A shake-out is the same as a spring but with larger volume and larger price spread than that of a spring. It is followed by a quick reversal higher.
CorrectIncorrect -
Question 13 of 51
13. Question
An unusual increase in volume generally indicates the end or approaching culmination of a move.
CorrectIncorrect -
Question 14 of 51
14. Question
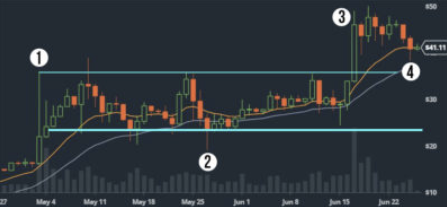
What point on the attached chart is a “Spring”?
CorrectIncorrect -
Question 15 of 51
15. Question

What point on the chart is a Jump Across The Creek?
CorrectIncorrect -
Question 16 of 51
16. Question
A jump across the creek has what attributes?
CorrectIncorrect -
Question 17 of 51
17. Question

What point on the chart is a Back Up To The Creek?
CorrectIncorrect -
Question 18 of 51
18. Question
What attributes accompanies a successful Back Up To The Creek?
CorrectIncorrect -
Question 19 of 51
19. Question
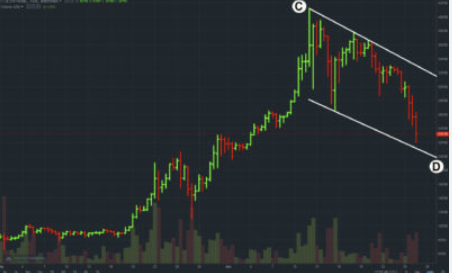
On the following chart where is the oversold condition trendline?
CorrectIncorrect -
Question 20 of 51
20. Question

On the chart where is the overbought position trendline?
CorrectIncorrect -
Question 21 of 51
21. Question
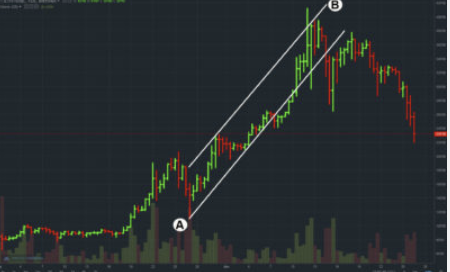
Where is the Support trendline?
CorrectIncorrect -
Question 22 of 51
22. Question

Where is the Supply trendline?
CorrectIncorrect -
Question 23 of 51
23. Question
Trend lines give possible indications as to where support or supply may be expected to enter as an opposing force.
CorrectIncorrect -
Question 24 of 51
24. Question
The violation of a trend line always indicates a change in the trend.
CorrectIncorrect -
Question 25 of 51
25. Question
Volume is a vital factor when identifying Buying and Selling Climaxes.
CorrectIncorrect -
Question 26 of 51
26. Question
Studying comparative strength/weakness can be very helpful in your trading.
CorrectIncorrect -
Question 27 of 51
27. Question
If a stock cannot develop any rallying power after returning to a former support area, it could be considered bearish.
CorrectIncorrect -
Question 28 of 51
28. Question
If you are contemplating purchasing a specific stock, having higher supports and higher tops would be confirming factors.
CorrectIncorrect -
Question 29 of 51
29. Question
If a stock is responsive to reactions and sluggish to rallies it would be considered a bullish indication?
CorrectIncorrect -
Question 30 of 51
30. Question
You should always try to have a reward/risk ratio of at least
CorrectIncorrect -
Question 31 of 51
31. Question

The top blue line on the chart is considered a?
CorrectIncorrect -
Question 32 of 51
32. Question

The bottom blue line on the chart is considered a
CorrectIncorrect -
Question 33 of 51
33. Question
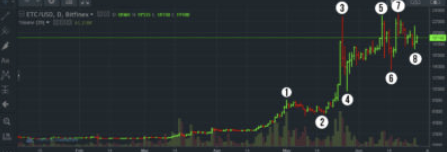
On the attached chart where is the Buying Climax located on the chart?
CorrectIncorrect -
Question 34 of 51
34. Question

Where is the Automatic Reaction on the chart?
CorrectIncorrect -
Question 35 of 51
35. Question

At what point do we have the Secondary Test on the chart?
CorrectIncorrect -
Question 36 of 51
36. Question
A Buying Climax will have increased price spread and climatic volume.
CorrectIncorrect -
Question 37 of 51
37. Question
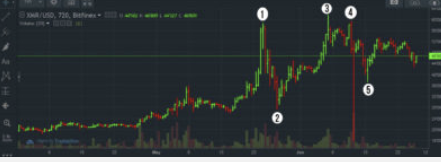
Please locate the upthrust on the chart.
CorrectIncorrect -
Question 38 of 51
38. Question

Point 4 is?
CorrectIncorrect -
Question 39 of 51
39. Question
If you are extremely comfortable with your position, you do not need to enter a stop order.
CorrectIncorrect -
Question 40 of 51
40. Question
The secret of success in trading the stock markets is like any other business. LIMITING LOSSES
CorrectIncorrect -
Question 41 of 51
41. Question
To stop a major sell off in a stock the following sequence will occur
CorrectIncorrect -
Question 42 of 51
42. Question
In a accumulation range volume tends to rise as the trading comes to an end
CorrectIncorrect -
Question 43 of 51
43. Question
In a distribution range, volume tends to be higher.
CorrectIncorrect -
Question 44 of 51
44. Question
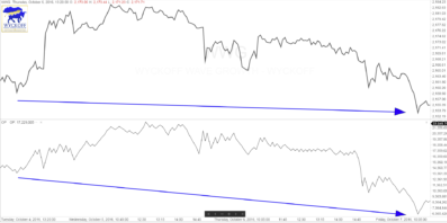
The following chart shows the OP reflecting strong pessimism?
CorrectIncorrect -
Question 45 of 51
45. Question
The Optimism Pessimism Index (OP) is hitting new highs compared to two weeks ago, but the price is well below its previous high. This action warns you up a possible change of trend to down?
CorrectIncorrect -
Question 46 of 51
46. Question
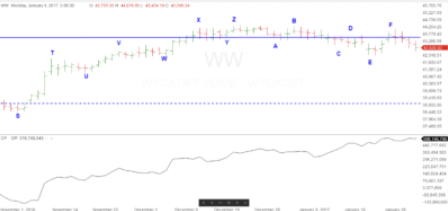
On the attached chart, we have the Wyckoff Wave and the Optimism Pessimism.
At points “Z” and “F” what is shown between the Wyckoff Wave and the O-P?
CorrectIncorrect -
Question 47 of 51
47. Question
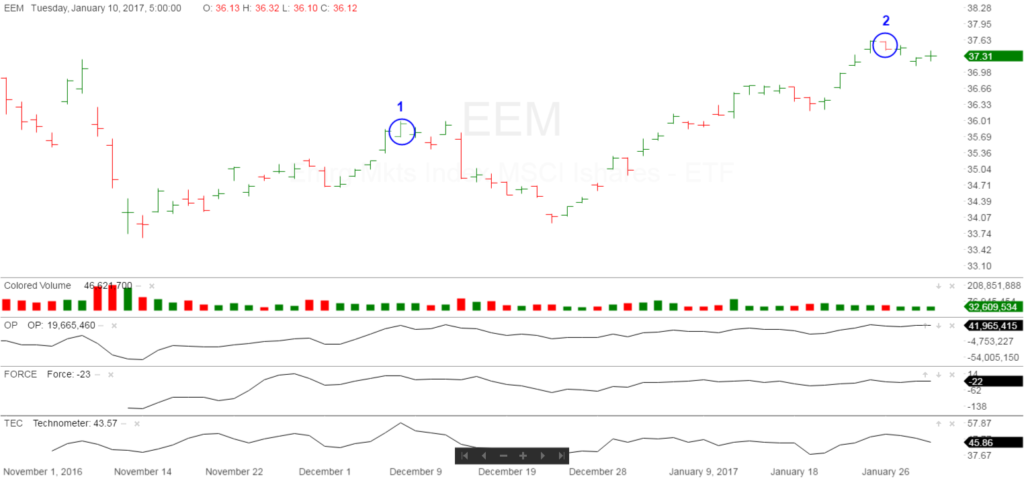
On the chart of EEM, the price is showing what when compared to the Force?
CorrectIncorrect -
Question 48 of 51
48. Question

What was the significance of the Technometer when the price of EEM was at point (2)?
CorrectIncorrect -
Question 49 of 51
49. Question
If the Technometer is registering an “oversold” reading, this means:
CorrectIncorrect -
Question 50 of 51
50. Question
If the Force Index is registering lower lows and lower highs, it means
CorrectIncorrect -
Question 51 of 51
51. Question
Inharmonious action occurs when both indexes are moving in the same direction but at different speeds.
CorrectIncorrect

